
A real-time map combines a stable geographic canvas with operational data that changes while someone is watching: vehicle positions, asset status, incidents, availability, or live sensor state. The useful contract is a current operational picture, not a prettier marker refresh. Kaleidr Studio currently positions live data layers, moving assets, custom basemaps, 3D visualization, reusable presets, and publishing as one authoring surface (Kaleidr, 2026).
The sections below separate a conventional interactive map from a live operational picture, then cover where Studio sits in the workflow, freshness, how current state reaches the map, B2B jobs, publishing, and measurement. Related reading includes Branded Interactive Maps in Kaleidr Studio, 3D Maps in Kaleidr Studio, Map Publishing Guide, and How to Build a Custom Branded Basemap. The rest of the article is written for teams that already own an operational feed and need a branded spatial interface, not for teams replacing a fleet, dispatch, or IoT platform.
Real-time map essentials
- Presentation stays stable: Rebuild the basemap only when the design changes, not when one asset moves.
- The source stays authoritative: Studio authors the spatial experience; the operational system still owns current state.
- Freshness is a field: Age, connection health, and unavailable state belong on the map, not only in logs.
- Identity is stable: Update geometry and status on the same asset ID; do not mint a new feature for every ping.
- Live and history stay separate: Current state and playback should not share one unmarked layer.
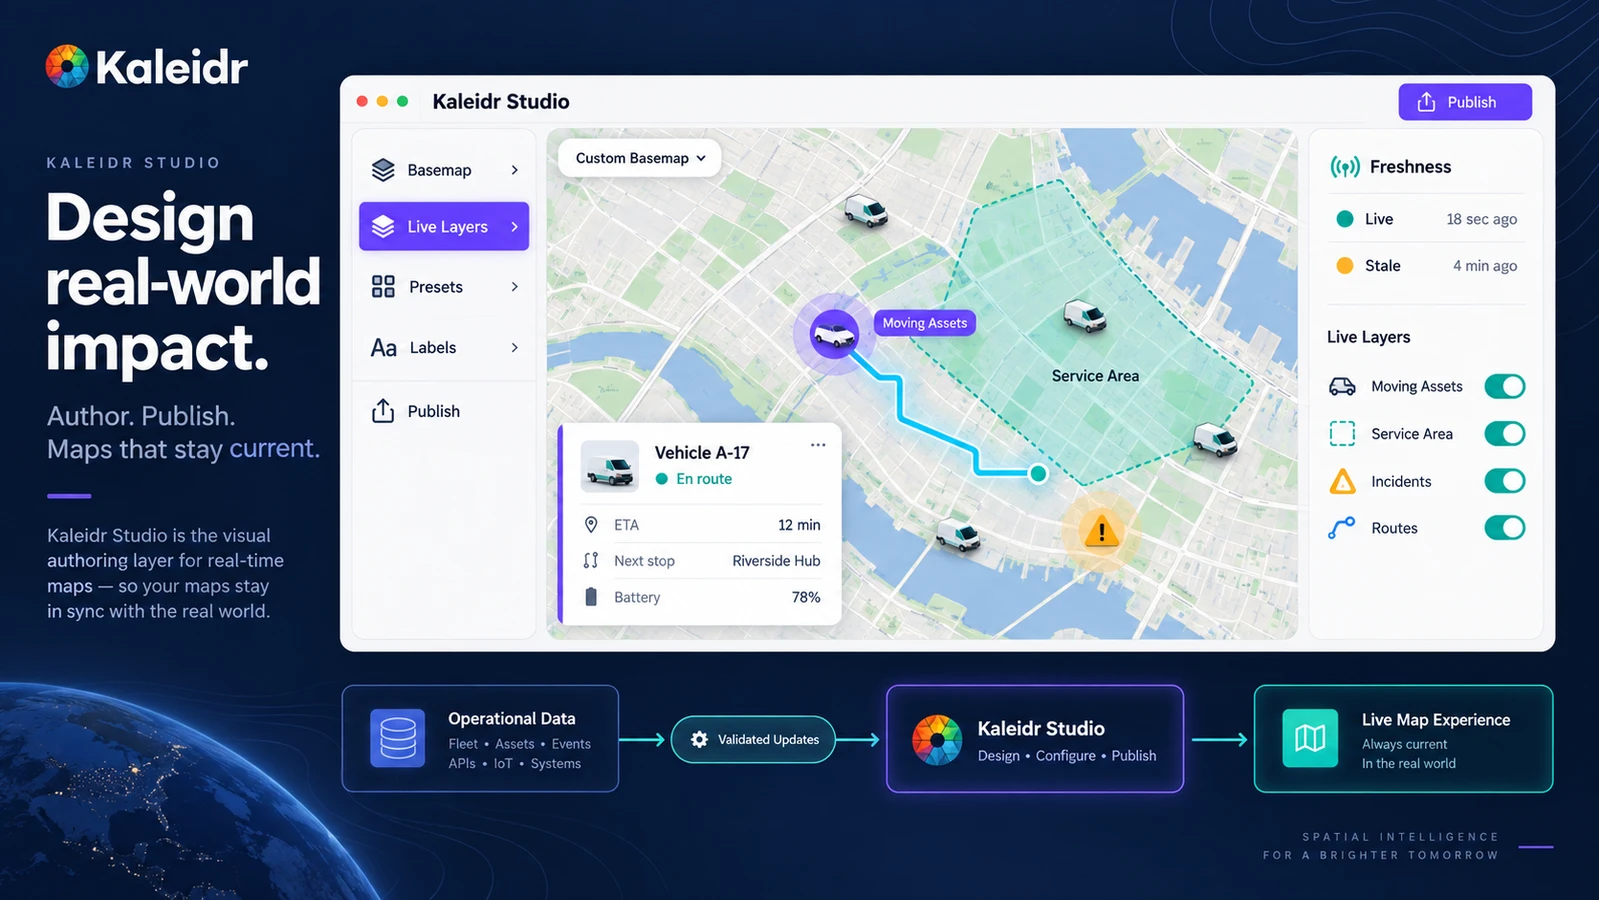
Real-time maps work best when the presentation stays stable while operational data changes underneath it.
What Makes a Real-Time Map Different From a Static Interactive Map?
A store locator, destination guide, or property catalog can remain useful when locations change only occasionally. A live operational map implies something stricter: the viewer is looking at the current picture, and an old marker can cause a wrong dispatch, a missed incident, or a false sense that a vehicle is still moving. Freshness, update cadence, source reliability, state transitions, error handling, and visual stability therefore belong in the product contract, not as afterthoughts once the pins look good.
The practical test is whether stale data changes the decision. Fleet dispatch often needs updates every few seconds. Parking availability, field-team status, or facility occupancy may be useful at 30–60 seconds. Inventory or building status can wait minutes. Sub-second refresh belongs to specialized control systems, not to every customer-facing map. Cadence should follow how old the information can become before the next action would be wrong.
A conventional interactive map can hide a missing record as an empty result. A live map has to distinguish “nothing is happening” from “the feed failed.” A vehicle that has not moved for ten minutes may be parked, or the last point may be stale. An incident icon that disappears may be resolved, or the connection may have dropped. Those two stories require different labels, different confidence, and often different operator actions.
Where Does Kaleidr Studio Fit as the Visual Authoring Layer?
Kaleidr Studio is designed so teams can create custom interactive maps with Kaleidr AI, then edit styles, layers, locations, content, and interactive experiences. Custom map tiles and branded basemaps, reusable layers and style presets, 3D terrain, live data layers, fleet and asset tracking, and publishing sit in the same authoring surface. Studio is where changing operational data becomes a branded spatial experience. The operational system remains the source of current positions and status.
Basemap hierarchy still matters when markers move. Roads, water, labels, and terrain should recede so vehicles, jobs, service areas, and alerts remain readable. Brand identity should guide the map; status still has to follow function. How to Build a Custom Branded Basemap covers the geographic canvas. Reusable presets named after the job—operational monitoring, live asset tracking, event operations—reduce drift across many live maps without forcing every surface to show the same density.
3D should stay contextual. Studio includes terrain, hillshade, real elevation, and extruded buildings. A pitched camera can clarify facilities, campuses, or dense event sites, but a moving fleet still needs a readable selected asset, not a decorative pitch that hides status. 3D Maps in Kaleidr Studio covers when depth helps. Live layers need additional visual roles such as current, recent, stale, offline, and warning so operational maps share one language.
How Should a Stable Map Sit Over Changing Operational Data?
A production live map usually runs from an authoritative operational source through a current-state API or stream, then through validation and normalization, into a live spatial layer on a Studio-designed map, and finally into a published or embedded viewer where an operator can act. Fleet, IoT, dispatch, booking, incident, inventory, and asset systems remain the source of truth. Studio controls how that information is organized, styled, layered, and experienced spatially.
The useful mental model is stable presentation plus changing operational state. Basemap, labels, roads, terrain, buildings, and static service areas can stay put. Vehicles, deliveries, incidents, jobs, availability, alerts, and sensor values can change. Rebuilding the whole map for every ping wastes rendering budget and makes the camera fight the user. The map structure should persist while the relevant features update.
Moving assets need stable IDs. Each vehicle, technician, job, or facility should keep one identity while longitude, latitude, status, heading, and updatedAt change. A selected vehicle should remain selected as it moves. Minting a new feature for every location ping breaks selection, history, and analytics. MapLibre GL JS shows the same identity-preserving idea in a browser map: GeoJSONSource.setData() replaces the GeoJSON on a source and re-renders, and updateData() can apply a diff when every feature already has a unique ID (MapLibre, 2026). Studio still owns the live-layer design on top of that kind of update: stable IDs, freshness, and the published map.
GeoJSON is a common interchange for live points, lines, and polygons in web maps, not the only storage format a host may use. A feature can carry status and a timestamp in properties while the geometry holds the current position or route. Host applications still validate coordinates, reject unknown IDs, and keep private operational fields off the public map. Layer hierarchy should keep reference geography below live assets, and alerts or the selected feature above both.
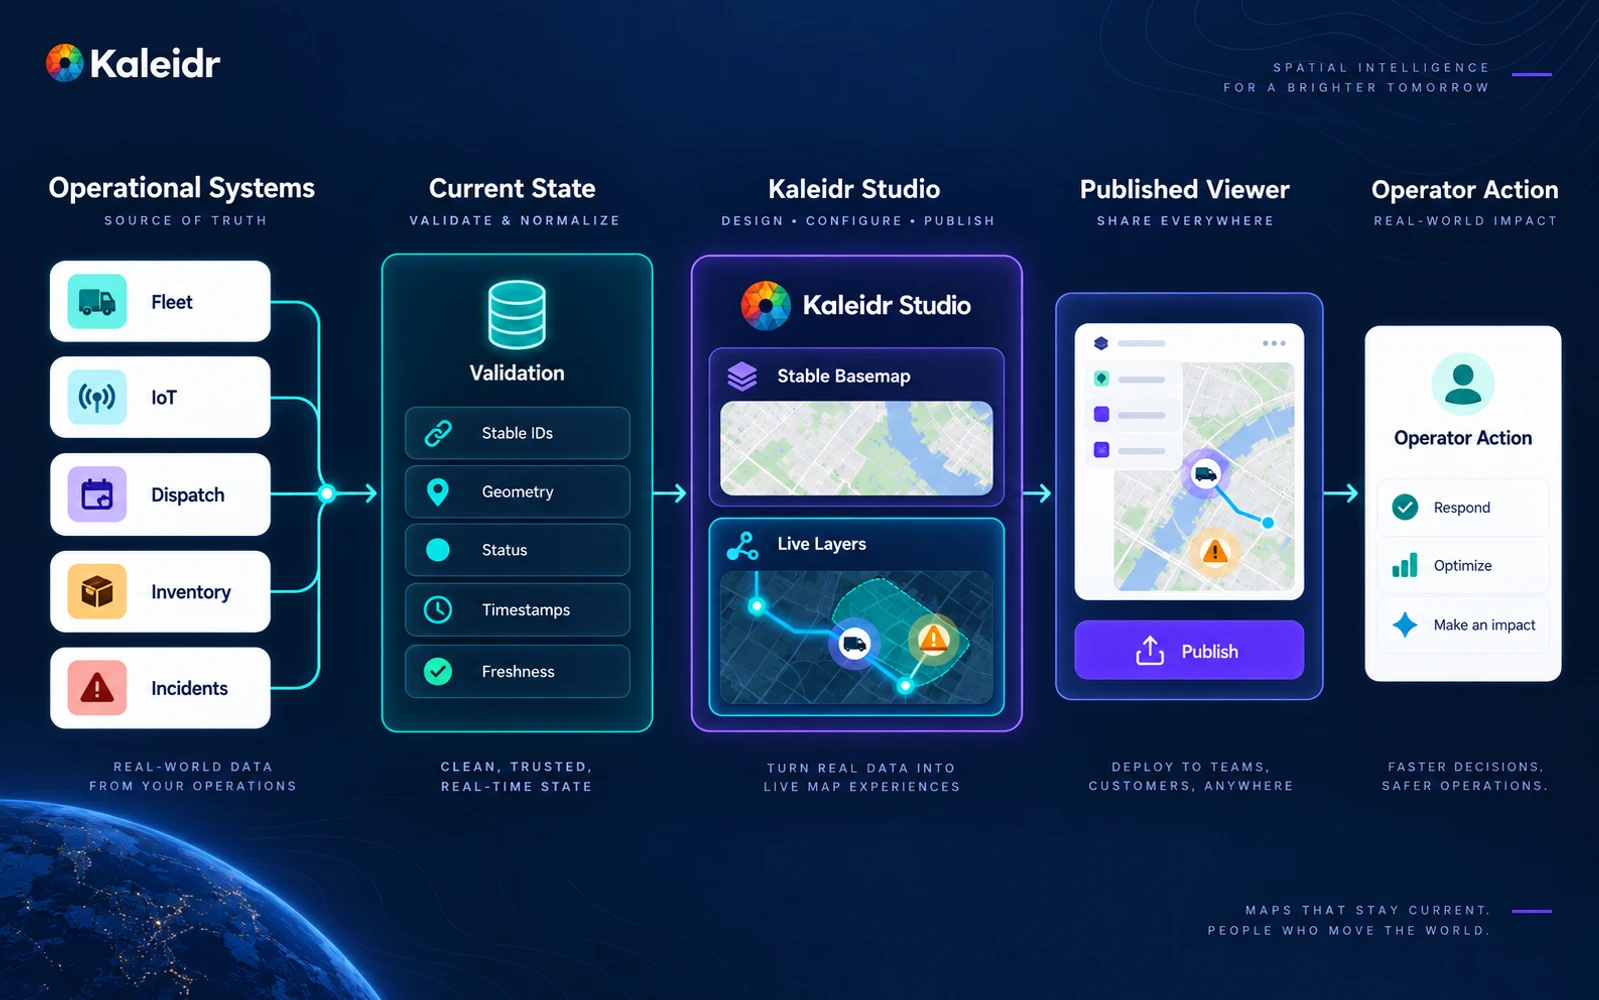
Keep the operational system authoritative and use Studio to control the spatial presentation.
How Should Freshness Appear on a Live Map?
Each live record should carry a timestamp the UI can convert into data age. Editorial thresholds such as current within 15 seconds, recent within a minute, stale within five minutes, and unavailable afterward are examples, not a Kaleidr schema. The business case sets the bands: a parked van and a dropped GPS fix must not share one confident marker. Connection health—connected, delayed, reconnecting, disconnected—belongs beside the asset, because a beautiful last-known point can be worse than an empty map.
Do not hide stale data by leaving the last icon in place with no label. Useful states include live, last updated a stated number of seconds ago, stale, feed unavailable, and location unknown. Color alone is not enough. Pair hue with icon, text, and timestamp so an operator who cannot rely on color still reads confidence. A live trail can show recent movement; a stale asset should not keep a motion streak that implies it is still traveling.
Live state and history answer different questions. Current state answers where the asset is now. History answers where it has been, which route it took, and when an incident opened. Mixing both on one unmarked layer makes yesterday's path look like today's assignment. Historical playback should be a labeled mode, with its own time cursor, so nobody mistakes a replay for the live picture. Time zone should be explicit when operators sit in more than one region.
Empty, partial, and reconnecting states are part of the same design. Zero assets can be a true idle shift. A partial feed can mean one region arrived and another timed out. Reconnection should not teleport every marker as if the gap never happened. Ordered updates, coalesced bursts, and an explicit “feed recovering” label keep the map honest while the host retries.
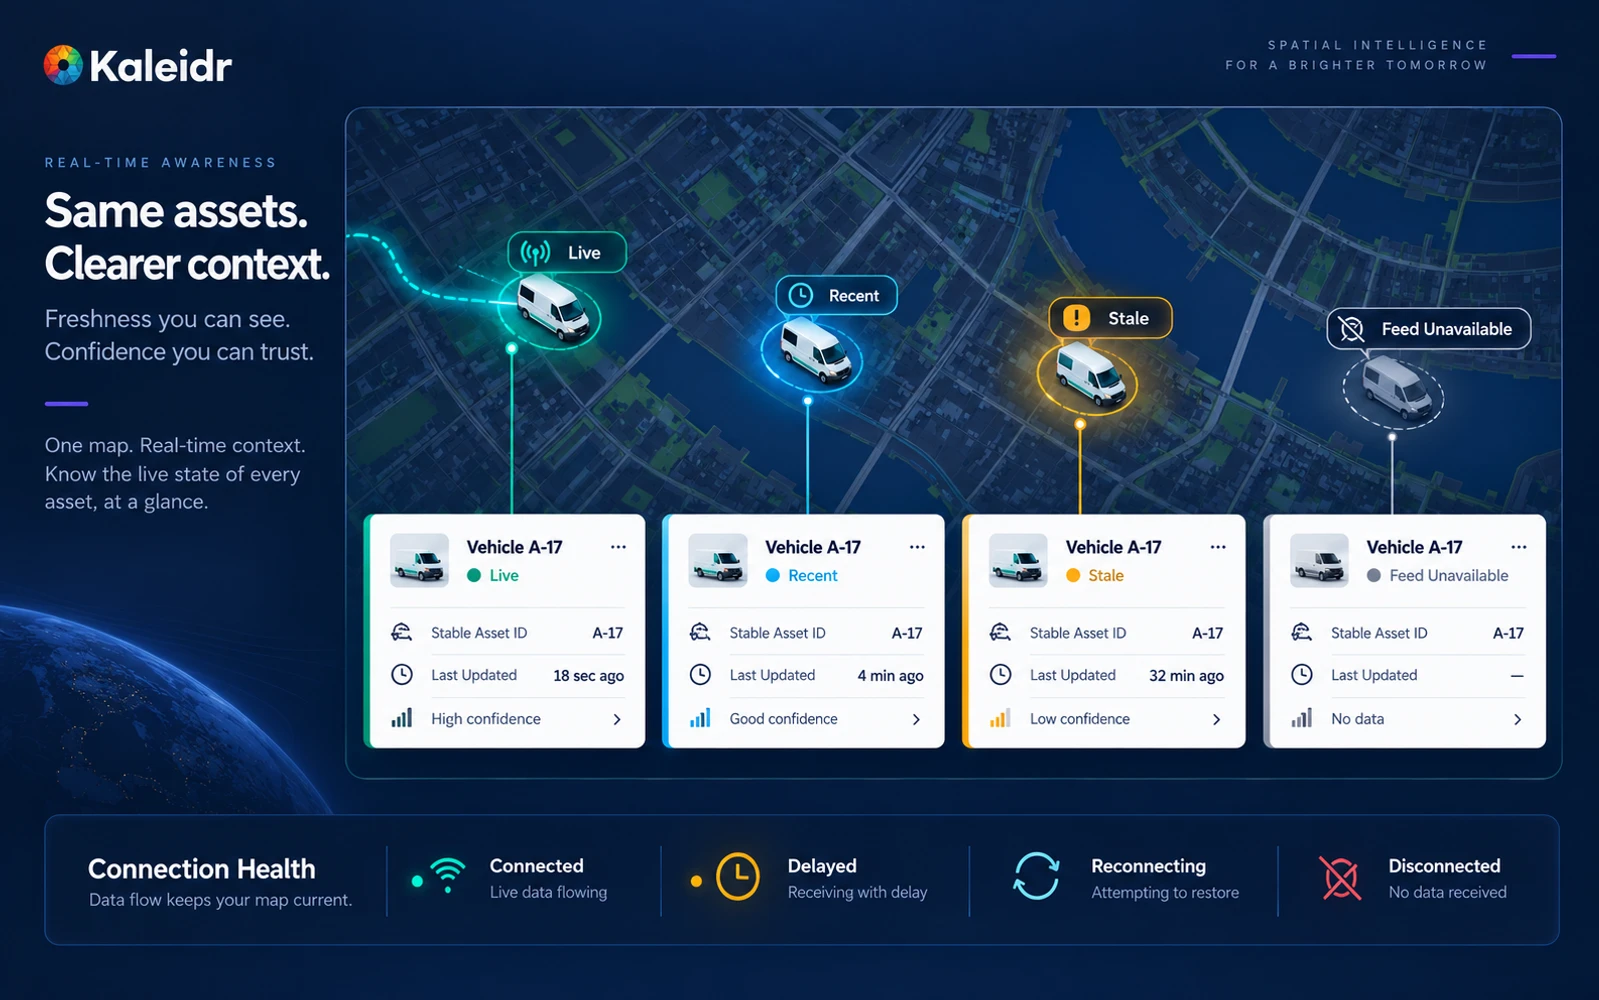
A real-time map should make freshness visible so old data never looks current.
The following comparison is editorial. Real deployments should fill the same columns from the feed they already operate.
| State | Operator reading | Typical visual treatment |
|---|---|---|
| Live | Current enough for the next action | Full opacity, motion only if the asset is moving |
| Recent | Usable, with a visible age | Full marker plus “updated n sec ago” |
| Stale | Do not dispatch on this point alone | Reduced confidence, stale label, no motion trail |
| Feed unavailable | The map cannot claim current location | Explicit unavailable or location-unknown state |
How Should Live Data Reach the Map?
The host application moves current state to the map. Polling is simple and cache-friendly when the decision interval is tens of seconds or minutes. Server-sent events let a server push messages to the browser over a persistent one-way connection (MDN Web Docs, 2026). The WebSocket API opens a two-way session so the client can send and receive without polling; MDN notes that the standard WebSocket interface does not provide backpressure, so an application that cannot keep up can fill memory or become unresponsive (MDN Web Docs, 2026). Choose the transport from update frequency, directionality, infrastructure, and volume. Studio still owns the visual layer: basemap, live-layer styling, freshness treatment, and the published experience.
A snapshot plus subsequent stream is a strong production pattern. The client loads a validated current set, then applies ordered incremental updates. Full replacement is easier to reason about for small collections. Incremental updates scale better when thousands of assets move, provided IDs are stable and missed messages can be reconciled. MapLibre's live realtime-data example repeatedly changes a point and calls setData() on the GeoJSON source (MapLibre, 2025). The same snapshot-then-update shape is what a Studio live layer needs from the operational feed: current features, then ordered changes, with IDs that do not reset on every ping.
Credentials stay on the server. The browser should receive only the fields the published view needs: public position, coarse status, and freshness, not internal dispatch notes, customer PII, or service keys. Public customer maps and internal operations maps should be separate views even when they share a basemap. Data minimization is a product requirement, not only a legal afterthought.
Animation should explain meaningful movement, not decorate every ping. Camera follow-mode is useful when an operator is tracking one asset and destructive when it steals pan and zoom from someone inspecting a region. At low zoom, cluster or aggregate instead of drawing every vehicle. Large datasets need coalescing, viewport filtering, and a plan for what happens when updates arrive faster than the renderer can draw. The map should remain a decision surface under load, not a particle system.
Which B2B Jobs Need Real-Time Maps in Kaleidr Studio?
Different industries bring different live data, but the Studio design layer can keep the spatial experience consistent: branded basemap, live layers, reusable presets, optional 3D context, and a published or embedded viewer. Kaleidr currently publishes a Location template for live fleet and field-asset tracking, alongside hospitality, property, and retail starting points (Kaleidr, 2026). Studio supplies the authored map. The template supplies surrounding page structure.
Fleet and logistics maps should answer which assets need attention, not how many markers can move. Current position, status, route, assigned job, service region, latest update, and alert state are the usual fields. Field service combines technicians, jobs, service areas, and live locations so an operator can inspect, reassign, or open a route. Facilities maps highlight equipment incidents against a stable floor or campus context. Event operations add temporary zones and service teams that exist only for the show window. Property portfolios and retail networks more often show availability, open state, or incident status than constant motion.
Alerts should be a designed layer, not a louder copy of raw state. A geofence breach, a stale high-priority asset, or an incident in a customer-visible zone deserves a distinct treatment and a next action. Spatial rules such as inside a service area, outside a geofence, or clustered near an incident belong in the host application that already owns those policies. An AI map assistant on top of a live map still must not invent current state from training memory. The operational system remains authoritative; the language model can explain grounded records after the application has authorized them.
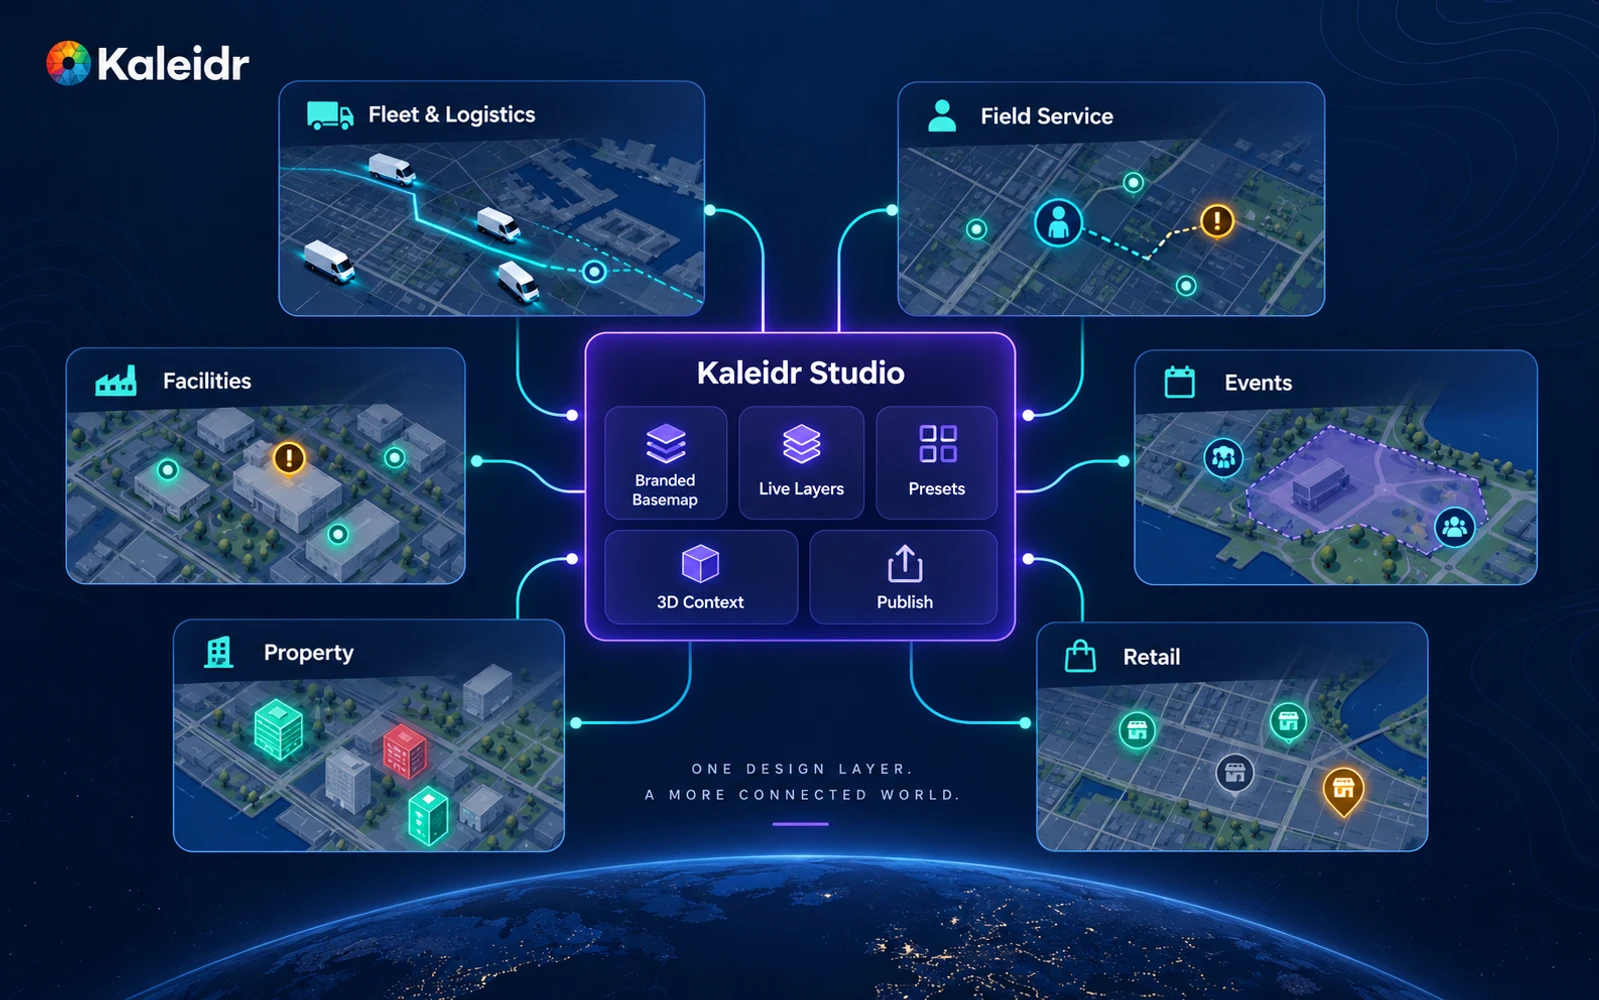
Different industries use different live data, but the Studio design layer can keep the spatial experience consistent.
How Should Teams Publish, Measure, and Keep the Map Readable?
A live map that looks correct in Studio can still fail in the published container. Test loading, empty, partial-feed, stale, and reconnection states on the actual surface, at the zooms operators use, on mobile density, and with reduced motion. Map Publishing Guide covers the production handoff. Standalone pages, embeds, and product integrations should inherit the same basemap, live-layer roles, and selected-state language. Version the visual system so a later preset change does not silently restyle yesterday's operations map.
Measurement should include feed health, not only pageviews. Kaleidr Analytics measures map loads, sessions, interactions, place engagement, and spatial patterns (Kaleidr, 2026). Data age, stale-feature rate, reconnects, time-to-select an asset, and operational actions started are the extra live-map diagnostics that sit on top of those engagement measures. Spatial Analytics vs. Web Analytics covers why a session count cannot tell an operator whether the live picture was trusted. Track whether people complete the job the map exists for.
Use Studio-first when the work is basemap hierarchy, branding, layer styling, presets, 3D context, and publishing a live spatial experience on top of a feed the host already owns. Use a deeper custom integration when the product needs specialized control-room interaction or application logic beyond map authoring. A monitoring dashboard can show tables and charts; a real-time map should still make place, freshness, and the next action spatially obvious.
Explore Kaleidr Studio to design branded basemaps, live layers, presets, and published map experiences. Explore Kaleidr Analytics to measure engagement after the map is live.
FAQs
What is a real-time map?
A real-time map displays spatial data that changes while the user is viewing it, such as moving vehicles, incidents, availability, operational status, or live sensor state.
Does real-time always mean instant updates?
No. The correct update interval depends on how quickly stale data changes the user's decision. Some workflows need seconds; others can refresh every minute or several minutes.
What is the most important field in a live map?
Stable feature identity and a reliable update timestamp are both critical. Without identity, updates cannot be reconciled cleanly; without freshness, old state can look current.
Should a live map use WebSockets?
Not necessarily. Polling, server-sent events, and WebSockets are all valid patterns depending on update frequency, directionality, infrastructure, and scale.
What live-map capabilities does Kaleidr Studio include?
Kaleidr Studio includes live data layers, moving-asset tracking, custom basemaps, 3D visualization, reusable layers, and published map experiences.
How does live data connect to a Studio map?
Studio designs the branded map, live layers, and published experience. The operational system remains the source of current state, and the host application supplies updates through the integration path chosen for that deployment.
Can Kaleidr Studio track fleets?
Kaleidr Studio can track vehicles, fleets, and live feeds. Kaleidr also publishes a Location template for live fleet and field-asset tracking.
What is the difference between live data and historical data on a map?
Live data represents the current state. Historical data represents previous states or movement. The two should usually be modeled as separate layers or a clearly labeled playback mode.
How should a map show stale data?
Use an explicit stale state, age label, reduced-confidence styling, or unavailable state rather than showing the last known position as unquestionably current.
Can real-time maps use GeoJSON?
Yes. GeoJSON is commonly used to represent live points, lines, and polygons in web maps. MapLibre, for example, can update a GeoJSON source with setData() and re-render the map.
Should every moving asset be animated?
No. Animation should help users understand meaningful movement. Excessive animation can harm readability and performance.
How should real-time map performance be measured?
Track feed uptime, data age, update latency, stale-feature rate, reconnects, rendering performance, and the operational actions users complete from the map.
References
- Kaleidr. AI Map Maker for Branded Interactive Maps. Accessed 21 September 2026. https://kaleidr.com/studio
- Kaleidr. Map Website Templates. Accessed 21 September 2026. https://template.kaleidr.com/
- MapLibre. GeoJSONSource. MapLibre GL JS API. Accessed 21 September 2026. https://maplibre.org/maplibre-gl-js/docs/API/classes/GeoJSONSource/
- MapLibre. Add live realtime data. MapLibre GL JS Examples. Page metadata lists creation on 25 June 2025; accessed 21 September 2026. https://maplibre.org/maplibre-gl-js/docs/examples/add-live-realtime-data/
- MDN Web Docs. WebSocket API (WebSockets). Last modified 12 September 2026. https://developer.mozilla.org/en-US/docs/Web/API/WebSockets_API
- MDN Web Docs. Server-sent events. Accessed 21 September 2026. https://developer.mozilla.org/en-US/docs/Web/API/Server-sent_events
- Kaleidr. Map Engagement and Location Analytics. Accessed 21 September 2026. https://kaleidr.com/analytics
- Kaleidr. Branded Interactive Maps in Kaleidr Studio. Accessed 21 September 2026. https://kaleidr.com/blog/branded-interactive-maps-in-kaleidr-studio
- Kaleidr. 3D Maps in Kaleidr Studio. Accessed 21 September 2026. https://kaleidr.com/blog/3d-maps-kaleidr-studio
- Kaleidr. Map Publishing Guide. Accessed 21 September 2026. https://kaleidr.com/blog/map-publishing-guide
- Kaleidr. How to Build a Custom Branded Basemap. Accessed 21 September 2026. https://kaleidr.com/blog/how-to-build-a-custom-branded-basemap
- Kaleidr. Spatial Analytics vs. Web Analytics. Accessed 21 September 2026. https://kaleidr.com/blog/spatial-analytics-vs-web-analytics
@misc{kaleidr_studio_realtime_2026,
  title  = {AI Map Maker for Branded Interactive Maps},
  author = {{Kaleidr}},
  year   = {2026},
  note   = {Accessed 21 September 2026},
  url    = {https://kaleidr.com/studio}
}

@misc{kaleidr_template_store_realtime_2026,
  title  = {Map Website Templates},
  author = {{Kaleidr}},
  year   = {2026},
  note   = {Accessed 21 September 2026},
  url    = {https://template.kaleidr.com/}
}

@misc{maplibre_geojson_source_2026,
  title  = {GeoJSONSource},
  author = {{MapLibre}},
  year   = {2026},
  note   = {MapLibre GL JS API; accessed 21 September 2026},
  url    = {https://maplibre.org/maplibre-gl-js/docs/API/classes/GeoJSONSource/}
}

@misc{maplibre_live_data_2025,
  title  = {Add live realtime data},
  author = {{MapLibre}},
  year   = {2025},
  note   = {MapLibre GL JS Examples; og:created 2025-06-25; accessed 21 September 2026},
  url    = {https://maplibre.org/maplibre-gl-js/docs/examples/add-live-realtime-data/}
}

@misc{mdn_websocket_2026,
  title  = {WebSocket API (WebSockets)},
  author = {{MDN Web Docs}},
  year   = {2026},
  note   = {Last modified 12 September 2026},
  url    = {https://developer.mozilla.org/en-US/docs/Web/API/WebSockets_API}
}

@misc{mdn_sse_2026,
  title  = {Server-sent events},
  author = {{MDN Web Docs}},
  year   = {2026},
  note   = {Accessed 21 September 2026},
  url    = {https://developer.mozilla.org/en-US/docs/Web/API/Server-sent_events}
}

@misc{kaleidr_analytics_realtime_2026,
  title  = {Map Engagement and Location Analytics},
  author = {{Kaleidr}},
  year   = {2026},
  note   = {Accessed 21 September 2026},
  url    = {https://kaleidr.com/analytics}
}

@misc{kaleidr_branded_maps_studio_2026,
  title  = {Branded Interactive Maps in Kaleidr Studio},
  author = {{Kaleidr}},
  year   = {2026},
  note   = {Accessed 21 September 2026},
  url    = {https://kaleidr.com/blog/branded-interactive-maps-in-kaleidr-studio}
}

@misc{kaleidr_3d_maps_studio_2026,
  title  = {3D Maps in Kaleidr Studio},
  author = {{Kaleidr}},
  year   = {2026},
  note   = {Accessed 21 September 2026},
  url    = {https://kaleidr.com/blog/3d-maps-kaleidr-studio}
}

@misc{kaleidr_map_publishing_2026,
  title  = {Map Publishing Guide},
  author = {{Kaleidr}},
  year   = {2026},
  note   = {Accessed 21 September 2026},
  url    = {https://kaleidr.com/blog/map-publishing-guide}
}

@misc{kaleidr_branded_basemap_2026,
  title  = {How to Build a Custom Branded Basemap},
  author = {{Kaleidr}},
  year   = {2026},
  note   = {Accessed 21 September 2026},
  url    = {https://kaleidr.com/blog/how-to-build-a-custom-branded-basemap}
}

@misc{kaleidr_spatial_vs_web_analytics_2026,
  title  = {Spatial Analytics vs. Web Analytics},
  author = {{Kaleidr}},
  year   = {2026},
  note   = {Accessed 21 September 2026},
  url    = {https://kaleidr.com/blog/spatial-analytics-vs-web-analytics}
}