
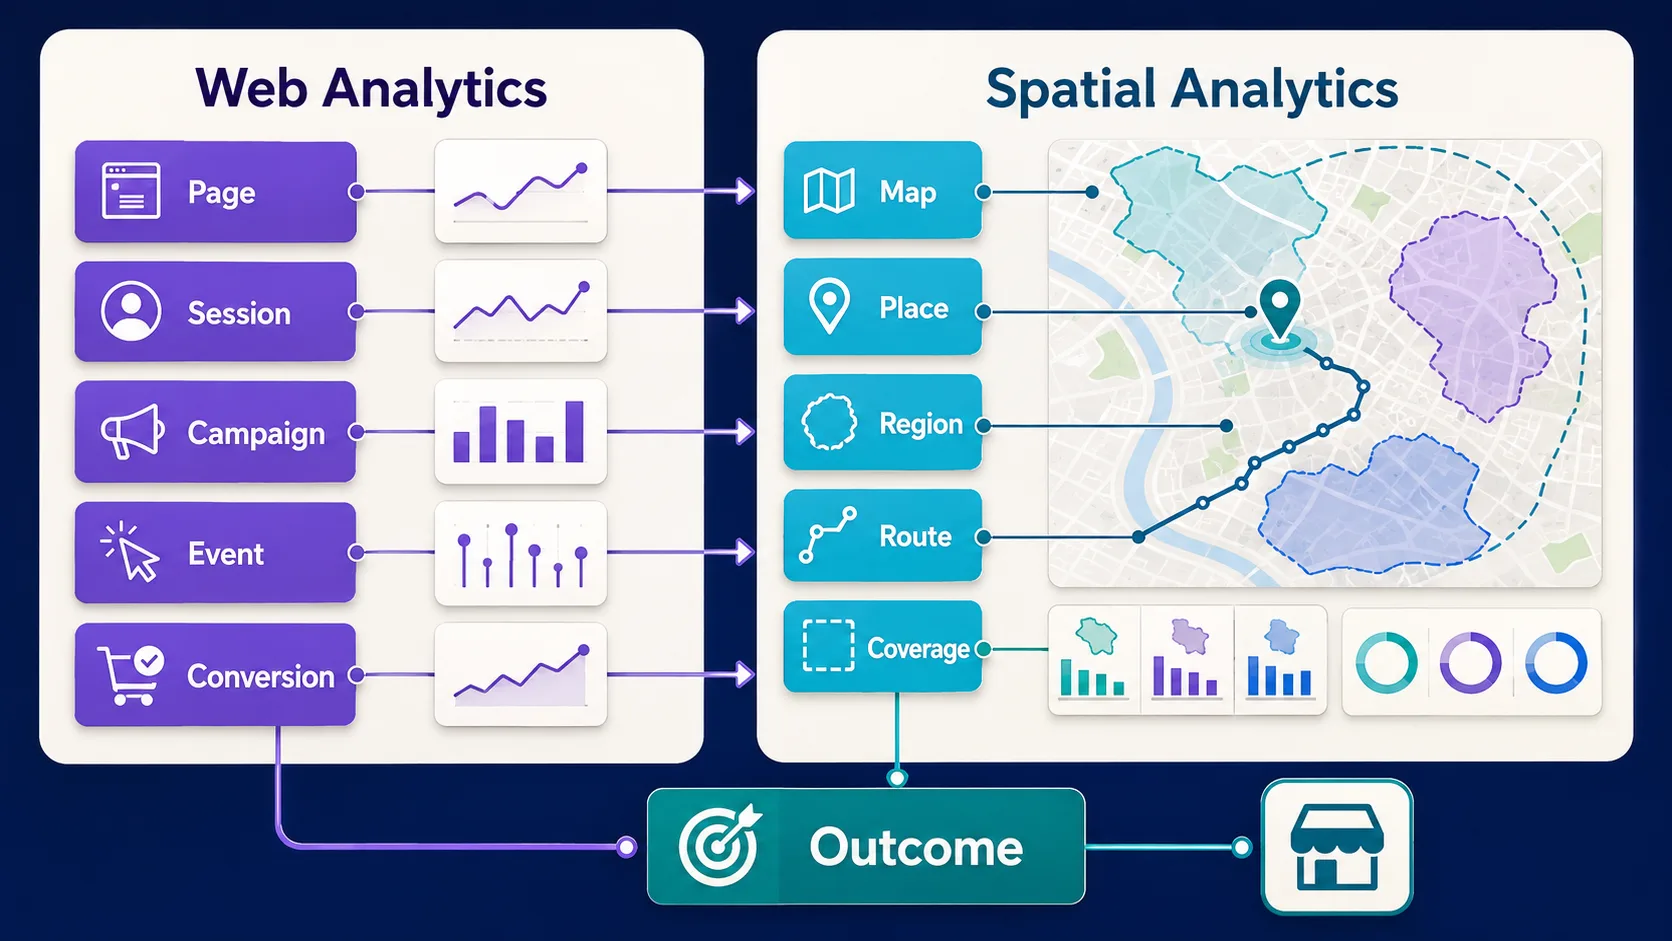
Spatial analytics vs. web analytics is a layering problem for map products, not a replacement decision. Web analytics measures pages, sessions, campaigns, events, and conversions. Spatial analytics adds maps, places, regions, routes, coverage, geographic friction, and location-dependent outcomes so teams can see where a customer decision succeeds or fails. Map products usually need both layers: acquisition context from web analytics, and place-centered measurement for the map itself.
The sections below separate the two measurement jobs, document Kaleidr Analytics from its current public page, then cover funnel design, ownership, identifiers, geographic friction, privacy, and when a dedicated spatial layer is worth the cost. Related reading includes Spatial Analytics Dashboard KPIs for Map Products, Location Intelligence Customer Experience Maps, Place Ranking API, and Private Location Data for AI Map Workflows. Teams that already run web analytics can skip to the two-layer architecture; teams still choosing a north-star metric should start with the funnel.
Comparison essentials
- Keep both layers: Web analytics owns acquisition and site-wide conversion; spatial analytics owns map, place, and coverage questions.
- Place is the missing unit: A map interaction can involve many locations at once, so a URL is not enough.
- Follow Discover → Compare → Act: Marker clicks and pan counts are supporting signals, not outcomes.
- Join with stable IDs: Session, task, and place identifiers connect tools without copying every event.
- Confirm the product contract: Kaleidr Analytics currently documents map and place engagement, not a full host conversion schema.
How Does Spatial Analytics vs. Web Analytics Differ for Map Products?
The useful split is the unit of analysis. Web analytics is organized around pages, screens, sessions, campaigns, and conversion events. Spatial analytics is organized around maps, places, regions, routes, search areas, service areas, and the geographic conditions that change a decision. Google Analytics currently defines an event as a way to measure a specific interaction or occurrence on a website or app, including a page load, a click, or a purchase (Event). A session is a period during which a user interacts with the site or app, and Google currently documents a default timeout of 30 minutes of inactivity (About Analytics sessions). Those definitions remain useful for map products. Event and session metrics do not, by themselves, answer which place was selected, which region had no eligible supply, or how far a customer was willing to travel.
A hotel page can be identified by a URL. A map interaction may involve ten hotels, three neighborhoods, a selected airport, and one route in the same view. Recording place_selected without place, region, map, and travel context leaves the event as a click. The same customer journey still needs campaign and landing-page context from web analytics, because geography does not explain how the session arrived.
| Question | Web analytics | Spatial analytics |
|---|---|---|
| What page did the user visit? | Core question | Supporting context |
| Which campaign drove the session? | Core question | Supporting context |
| Which map was opened? | Event or property | Core map dimension |
| Which place was selected? | Custom event or property | Core place dimension |
| Where did searches fail? | Usually needs custom modeling | Core geographic question |
| Which regions have demand but weak supply? | Not naturally spatial | Core spatial question |
| How far will customers travel? | Requires a custom location model | Natural spatial metric |
| Which locations lead to conversion? | Possible with custom IDs | Central place-to-outcome analysis |
| Where does map friction occur? | Hard to see from URLs alone | Core spatial diagnostic |
| Which customer action completed? | Core conversion metric | Must connect to the same outcome |
Why Is Page-and-Event Measurement Incomplete for a Map?
Google Analytics groups events into automatically collected, enhanced-measurement, recommended, and custom types, and custom events exist for interactions that those prepopulated names do not cover (Set up events). A map team can therefore send map_opened, place_selected, directions_clicked, or booking_started as custom events. The event model still leaves the geographic questions unspecified. Without place context, the team cannot tell which location, which region, which map, how far from the user's origin, whether the place sat inside the requested area, whether nearby alternatives existed, or whether that place repeatedly wins or loses across markets.
High pan and zoom activity can mean engagement, confusion, poor initial framing, wrong search results, or difficulty finding a place. A long AI conversation can mean deep exploration or repeated misunderstanding. A useful measurement strategy therefore separates interaction (what the user did), resolution (whether the map helped the user find or understand the right place), and outcome (whether the intended next action occurred). Map loads answer whether users reached the map. Loads do not answer whether the map helped. Treat them as the top of the funnel, then connect them to search success, place selection, and a business action.
What Does Kaleidr Analytics Currently Document?
Kaleidr currently describes Analytics as a dashboard for map and place engagement that organizes sessions, views, interactions, and audience activity so teams can see how people discover and use maps (Map Engagement and Location Analytics). The same public page lists four product areas: Dashboards for reach, views, and engagement; Audience for audience location and activity across maps; Engagement for sessions, views, and interactions per map; and Insights for AI-powered spatial trends and actionable signals. The FAQ states that teams can measure map loads, sessions, views, and interactions, plus where audiences engage and which places draw attention. Traditional web analytics, the page says, “centers on pages and events,” while Kaleidr Analytics “centers on places and maps.”
That copy is authoritative about Kaleidr’s own positioning. The public page does not currently document a full raw event schema or a guaranteed list of automatic business-conversion events. Access is “rolling out to teams in stages,” and the CTA routes teams to request access rather than assuming every described workflow is already exposed in every account. The architecture below therefore treats documented map and place metrics as the Kaleidr Analytics contract, and treats booking, inquiry, pickup, and purchase events as host instrumentation that should join through stable identifiers. Confirm current availability on Pricing & Plans before depending on a specific production workflow.
How Should a Spatial Funnel Move from Discover to Act?
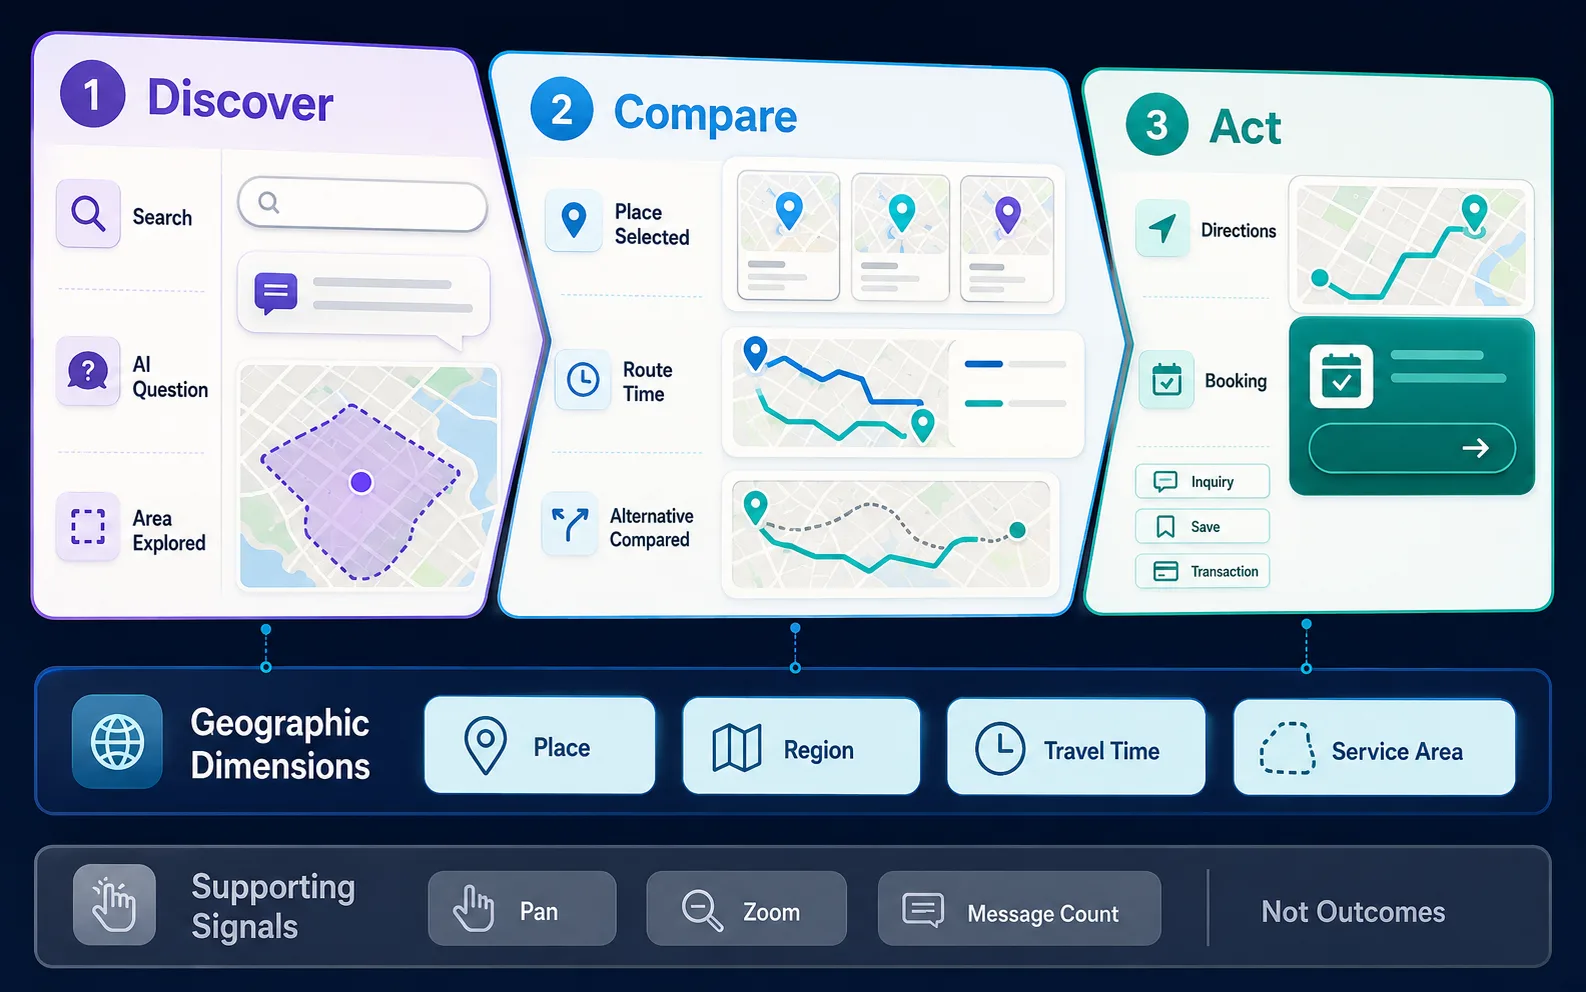
Google Analytics Funnel exploration visualizes the steps users take to complete a task and shows where they succeed or fail at each step (Funnel exploration). A map product needs the same discipline with geographic entities. Kaleidr’s location-intelligence writing already frames the customer job as discover, compare, and act on the right place (Location Intelligence Customer Experience Maps). For a location-aware map, Discover includes search, an AI question, a category choice, or an area explored. Compare includes a place opened, a second place inspected, route time viewed, or a map/list selection change. Act includes directions, booking, inquiry, store selection, pickup, a started route, or a save.
The funnel is stronger than “map opened, then marker clicked,” because it follows the customer decision rather than renderer activity. Pans, zooms, layer toggles, and message counts remain useful diagnostics. They should not all become KPIs. A dashboard with twenty interaction counts and no task outcome can look sophisticated while explaining very little. Segment the same funnel by place, region, travel-time band, and service area so the team can ask whether conversion falls when the nearest eligible option is farther than customers will travel.
How Should Web Analytics and Spatial Analytics Share Ownership?
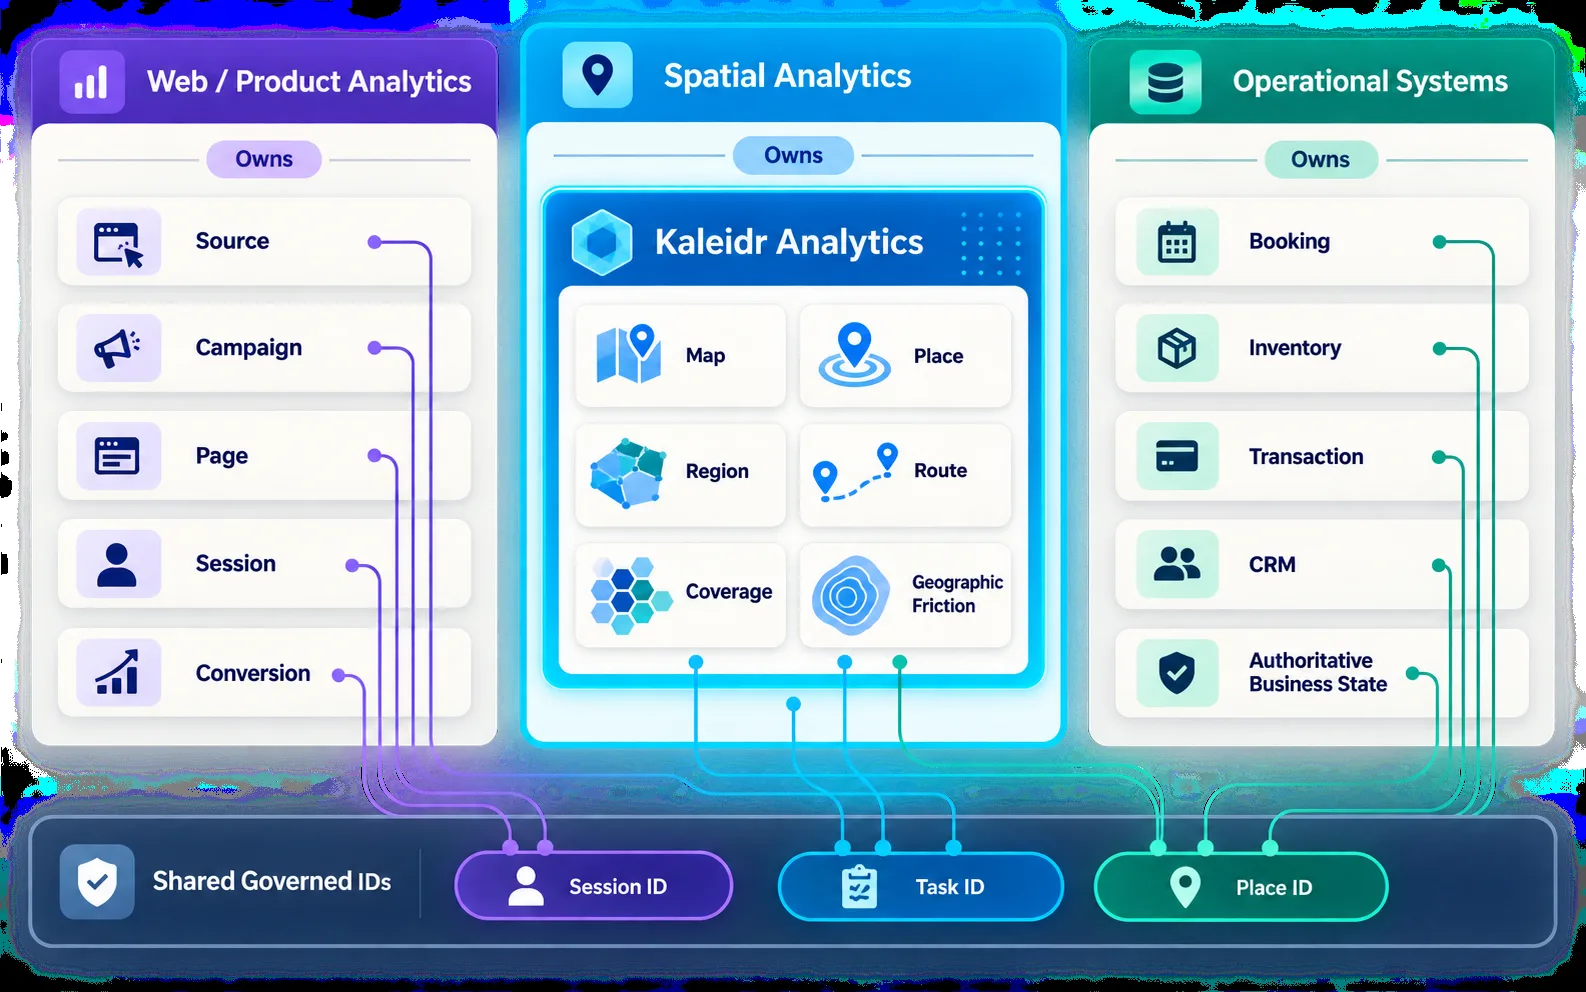
The strongest architecture gives each system a job and joins only what the question requires. Web and product analytics should own source, campaign, page, session, and site-wide conversion. Spatial analytics should own map, place, region, route, coverage, geographic friction, and spatial outcome context. Operational systems should own inventory, booking, transaction, CRM state, and other authoritative business records. Google currently documents that reports, Explorations, the Data API, and BigQuery can apply different identity, modeling, thresholding, and availability rules (Compare Analytics reports and data exported to BigQuery). Copying every map event into every platform recreates that inconsistency at larger cost.
Join the layers with session_id, task_id, and place_id where the question needs them. A paid-search campaign can then be read as: campaign to property map to downtown region to listing selected to inquiry started. The acquisition layer explains how the user arrived. The spatial layer explains how location influenced the decision. The host system remains the source of truth for whether the inquiry or booking actually occurred. Kaleidr Analytics can supply the map and place context; it should not be asked to duplicate the booking ledger.
Why Do Stable IDs Matter More Than Place Names?
A place name is a display string. Duplicate names, renamed locations, localization, and punctuation differences all break joins. A stable place_id can appear on place_selected in the map layer and again on booking_started in the host system, so the two events describe the same location even when the public name changes. Display names can remain properties. The identifier should stay stable, and the same rule applies to map_id and region_id.
Event names in this article are editorial examples, not documented automatic Kaleidr Analytics events. A practical taxonomy might include map_opened, map_ready, map_search_submitted, map_results_returned, map_no_result, map_place_selected, map_route_opened, and map_action_started, with outcome names kept business-specific (booking_started, property_inquiry_started, store_directions_opened). Verify the current product schema before treating any of those strings as a shipped Kaleidr event. Ranking products should also record selected rank, because the first result can win clicks through presentation rather than preference; Place Ranking API covers that presentation bias on the retrieval side.
What Unique Questions Can Geographic Friction Answer?
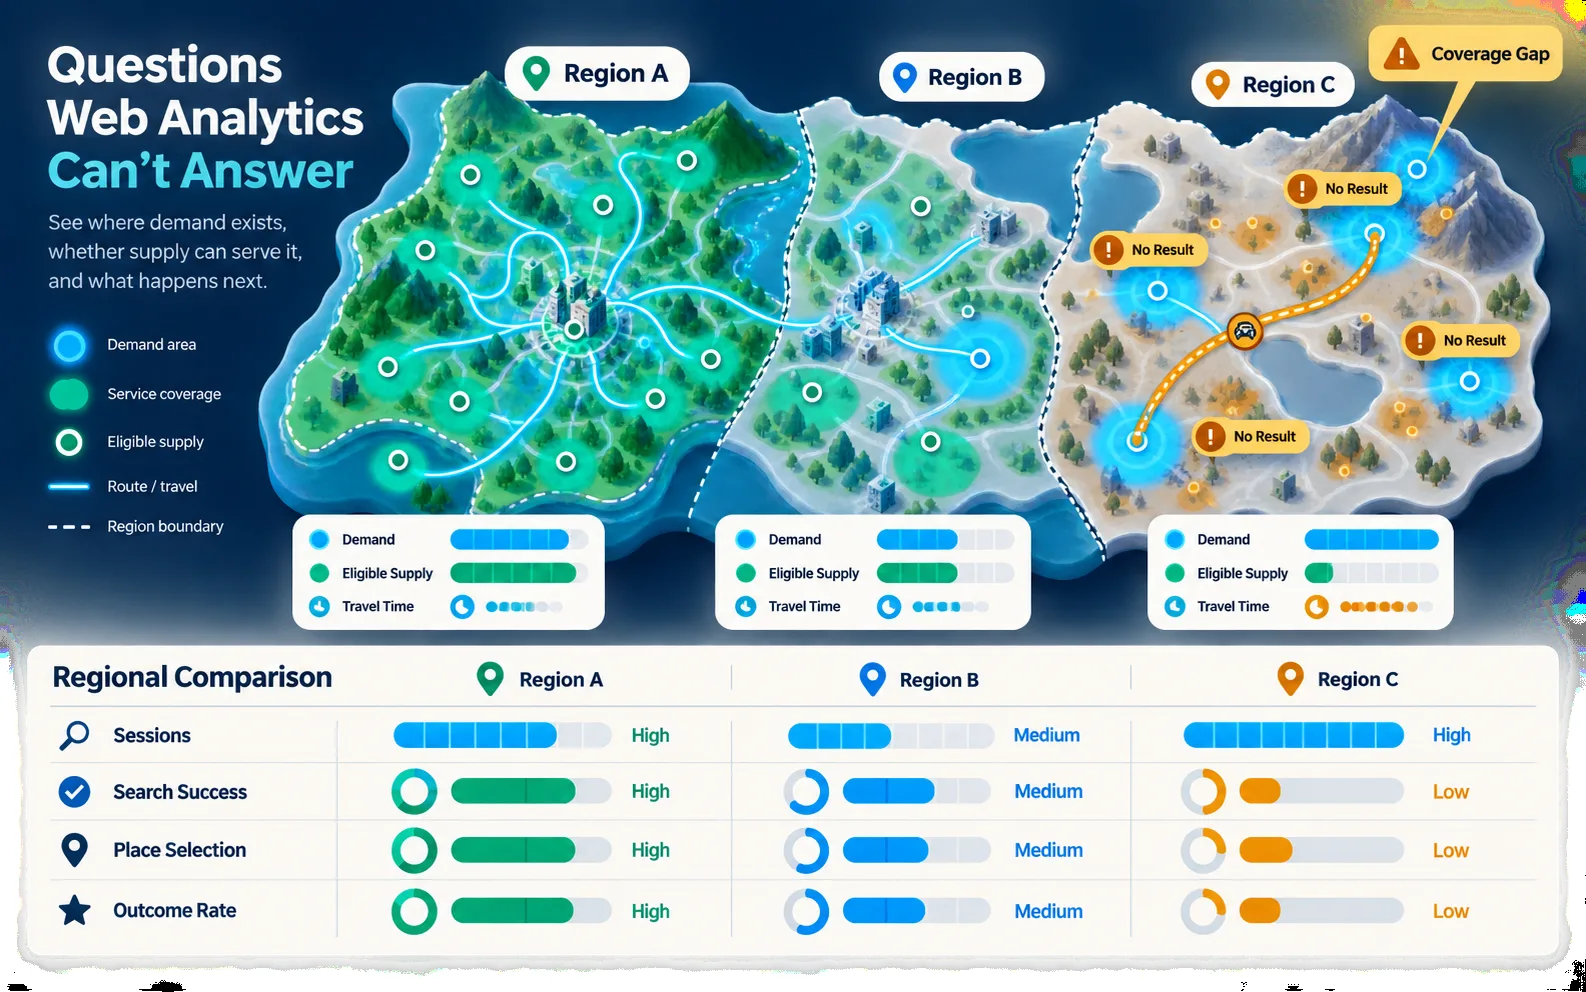
Spatial analytics becomes useful when events are grouped by geography and compared as rates. Neighborhood, city, market, service territory, sales region, and venue zone are all legitimate region dimensions if they are governed. The questions that URLs cannot answer reliably include where demand concentrates, where selection rate is low, where users repeatedly broaden search, and which service areas have no eligible supply. Search geography and user geography are not the same: a person in one region can search hotels in another, so model origin separately from viewport, typed destination, drawn polygon, or route corridor.
A no-result event should carry a reason where possible: no candidates, no eligible supply, outside service area, inventory unavailable, query not understood, or authorization removed all results. A simple zero-result count does not tell operators what to fix. Coverage analytics then compares demand with available geographic coverage: marketplaces without providers, stores farther than customers will travel, property search without active inventory, hospitality neighborhoods with interest but weak partners. Heatmaps without denominators mislead, because a dense cell often shows where more users already are rather than where performance is better. Preserve selection rate, search-success rate, and outcome rate. Large regions naturally contain more events; normalize by sessions, eligible supply, or map views before ranking territories.
How Should Teams Handle Location Privacy in Analytics?
The W3C Geolocation specification currently states that retrieving a device’s geographic location “also discloses the location of the user of the device, thereby potentially compromising the user’s privacy,” and it tells developers that privacy laws in their jurisdictions can govern usage and access (Geolocation). Most product analytics questions do not need permanent exact coordinates. Prefer region_id, place_id, distance band, travel-time band, and service_area_id when those answer the business question. A selected store ID plus an origin region is often enough; an exact origin latitude and longitude in the analytics warehouse is often not.
A place ID may be public while a user’s precise origin is sensitive. Do not treat them as equivalent. Aggregate reporting—searches by neighborhood, selection rate by service area, conversion by travel-time band—reduces both noise and identifiability. Low-volume geographic cells can become identifying, so teams may need suppression, minimum counts, or broader regions. The correct privacy policy depends on the deployment and legal context; this article describes the measurement design, not a determination for a specific reader. Authorization and minimization for private business locations are covered in Private Location Data for AI Map Workflows.
When Is Web Analytics Enough, and When Is Spatial Analytics Necessary?
Esri currently defines GIS as a technology used to create, manage, analyze, and map data by connecting location with descriptive information (What is GIS?). Spatial analytics for a map product is not the same job. Product teams do not need raster processing, network modeling, or geostatistics in order to analyze customer behavior with geographic entities and relationships. GIS can still support the underlying calculations. A heatmap is one visualization, not a strategy; tables, funnels, place rankings, region comparisons, travel-time bands, and service-area metrics are all spatial analytics.
A decorative contact map with one office, no place-level interaction, and no geographic dependency in the business outcome may not justify a dedicated spatial layer. Spatial analytics becomes necessary when the product must understand place performance, regional demand, coverage gaps, travel-time behavior, no-result geography, map-assisted conversion, or location-aware AI quality by region. Conversational maps add ai_question_submitted and related host events, but the strongest metrics remain question resolved, relevant place selected, and business action completed. A short conversation can be better than a long one. Real-time and 3D maps add reliability or camera diagnostics; those still sit behind the same outcome test. For 3D specifically, extra camera movement without better selection or task completion is not evidence of value (3D Maps in Kaleidr Studio).
What Mistakes Should Map Analytics Teams Avoid?
The recurring failure is treating map activity as success. Replacing web analytics deletes acquisition context. Tracking only map opens mistakes adoption for value. Counting pans and zooms as success lets friction look like engagement. Storing place names instead of IDs breaks joins. Mixing user geography with search geography makes the analysis inaccurate. Ranking regions by raw counts rewards size. Treating a heatmap as strategy produces no business decision. Tracking exact coordinates when a band would do grows privacy risk. Optimizing an AI map for message volume rewards long failure. Copying every event into every tool bloats the architecture. Assuming recommended event names are automatic Kaleidr events makes implementation wrong.
| Mistake | Result | Better approach |
|---|---|---|
| Replace web analytics completely | Acquisition context is lost | Use both layers |
| Track only map opens | Adoption mistaken for value | Connect to outcome |
| Treat pans and zooms as success | Friction can look like engagement | Measure resolution |
| Store place names instead of IDs | Joins break | Use stable IDs |
| Mix user geography and search geography | Analysis becomes inaccurate | Model them separately |
| Use raw counts by region | Large regions look better | Preserve denominators |
| Treat a heatmap as strategy | No business decision follows | Start with funnel and outcome |
| Track exact coordinates unnecessarily | Privacy risk grows | Use region, place, or bands |
| Optimize AI for message volume | Long failure looks good | Measure task resolution |
| Assume recommended events are automatic Kaleidr events | Implementation can be wrong | Verify the current product schema |
Measure Map and Place Engagement With Kaleidr
See how customers discover, explore, and engage with maps and places, then connect those signals to the outcomes the host product already measures. Explore Kaleidr Analytics for current map-load, session, view, interaction, audience, place-attention, and spatial-trend surfaces. Confirm the public contract before encoding a conversion path the page does not document.
FAQs
What is the difference between spatial analytics and web analytics?
Web analytics primarily measures pages, sessions, events, acquisition, and conversions. Spatial analytics adds maps, places, regions, routes, service areas, travel relationships, and other geographic dimensions.
Do map products still need Google Analytics or another web analytics tool?
Usually yes. Web analytics remains valuable for acquisition, page journeys, device behavior, and site-wide conversions. Spatial analytics should complement it.
What should a map product measure first?
Start with the customer outcome: a relevant place selected, directions opened, booking started, inquiry submitted, route resolved, or another location-dependent task.
Are map pans and zooms useful metrics?
Pans and zooms are useful diagnostic events, but they are weak success metrics by themselves. Heavy interaction can indicate either engagement or friction.
What is place engagement?
Place engagement measures how users interact with specific locations, such as selecting, comparing, saving, routing to, booking, or inquiring about them.
What is a spatial funnel?
A spatial funnel tracks a location-dependent journey such as map opened, search, eligible places, place selected, then business action, optionally segmented by region, place, travel time, or coverage.
Why are stable place IDs important?
Stable IDs let teams join map interactions with downstream business events even when place names change or duplicate names exist.
Should spatial analytics store raw latitude and longitude?
Not always. Many business questions can be answered with place IDs, region IDs, distance bands, travel-time bands, or service-area IDs, which reduces privacy risk.
What does Kaleidr Analytics currently measure?
Kaleidr’s current public page describes map loads, sessions, views, interactions, audience activity, where audiences engage, which places draw attention, and spatial trends.
Is Kaleidr Analytics generally available?
Kaleidr’s current public Analytics page says access is rolling out to teams in stages. Confirm current availability for your workspace before depending on a specific production workflow.
Is spatial analytics the same as GIS?
No. GIS is a broader set of geographic data and analysis tools. Spatial analytics in this product context means analyzing customer or product behavior using geographic entities and relationships.
How is this article different from the Spatial Analytics Dashboard KPI guide?
This article explains why spatial analytics differs from web analytics and how the two measurement layers fit together. The KPI guide focuses on dashboard structure, metric hierarchy, denominators, and reporting after the spatial measurement model is defined.
References
- Esri. What is GIS? Accessed 1 September 2026. https://www.esri.com/en-us/what-is-gis/overview
- Google Analytics. [GA4] Compare Analytics reports and data exported to BigQuery. Analytics Help. Accessed 1 September 2026. https://support.google.com/analytics/answer/13578783
- Google. Set up events. Google Analytics for Developers. Accessed 1 September 2026. https://developers.google.com/analytics/devguides/collection/ga4/events
- Google Analytics. About Analytics sessions. Analytics Help. Accessed 1 September 2026. https://support.google.com/analytics/answer/9191807
- Google Analytics. [GA4] Event. Analytics Help. Accessed 1 September 2026. https://support.google.com/analytics/answer/9356037
- Google Analytics. [GA4] Funnel exploration. Analytics Help. Accessed 1 September 2026. https://support.google.com/analytics/answer/9327974
- Kaleidr. Map Engagement and Location Analytics. Accessed 1 September 2026. https://kaleidr.com/analytics
- W3C. Geolocation. W3C Candidate Recommendation Snapshot, 26 March 2026. Accessed 1 September 2026. https://www.w3.org/TR/geolocation/
@misc{esri_what_is_gis_2026_09_01,
  title  = {What is GIS?},
  author = {{Esri}},
  note   = {Accessed 1 September 2026},
  url    = {https://www.esri.com/en-us/what-is-gis/overview}
}

@misc{google_bq_vs_reports_2026_09_01,
  title  = {{[GA4]} Compare Analytics reports and data exported to BigQuery},
  author = {{Google Analytics}},
  note   = {Analytics Help; accessed 1 September 2026},
  url    = {https://support.google.com/analytics/answer/13578783}
}

@misc{google_ga4_events_setup_2026_09_01,
  title  = {Set up events},
  author = {{Google}},
  note   = {Google Analytics for Developers; accessed 1 September 2026},
  url    = {https://developers.google.com/analytics/devguides/collection/ga4/events}
}

@misc{ga4_sessions_2026_09_01,
  title  = {About Analytics sessions},
  author = {{Google Analytics}},
  note   = {Analytics Help; accessed 1 September 2026},
  url    = {https://support.google.com/analytics/answer/9191807}
}

@misc{ga4_event_2026_09_01,
  title  = {{[GA4]} Event},
  author = {{Google Analytics}},
  note   = {Analytics Help; accessed 1 September 2026},
  url    = {https://support.google.com/analytics/answer/9356037}
}

@misc{ga4_funnel_exploration_2026_09_01,
  title  = {{[GA4]} Funnel exploration},
  author = {{Google Analytics}},
  note   = {Analytics Help; accessed 1 September 2026},
  url    = {https://support.google.com/analytics/answer/9327974}
}

@misc{kaleidr_analytics_2026_09_01,
  title  = {Map Engagement and Location Analytics},
  author = {{Kaleidr}},
  note   = {Accessed 1 September 2026},
  url    = {https://kaleidr.com/analytics}
}

@misc{w3c_geolocation_2026_03_26,
  title       = {Geolocation},
  author      = {{W3C}},
  institution = {W3C},
  year        = {2026},
  month       = mar,
  note        = {W3C Candidate Recommendation Snapshot, 26 March 2026; accessed 1 September 2026},
  url         = {https://www.w3.org/TR/geolocation/}
}