
Location intelligence for site selection combines the current location network, first-party demand, trade areas, travel time, and approved market data to compare where a business might expand. Spatial analytics can reveal coverage gaps and overlapping branches that deserve a property search. A shortlist is a screen, not a revenue forecast. Finance, real estate, and operations still decide whether a site should open, and Kaleidr Analytics can add map and place behavior without owning that decision.
The sections below separate market, trade-area, candidate, and portfolio decisions, then cover first-party demand, whitespace versus cannibalization, external data, where Kaleidr fits, and a narrow pilot. Related reading includes Spatial AI for Multi-Location Businesses, Location Intelligence vs. Spatial AI, Spatial Analytics vs. Web Analytics, and Spatial Analytics Dashboard KPIs for Map Products. Customer-facing branch choice and internal expansion planning should stay separate: one helps a customer act on a location that already exists, and the other helps the business decide where the network should grow.
Site-selection essentials
- Start from the current network: Stable location IDs, status, capacity, and a trusted outcome come before any new pin.
- Demand is not device location: Search geography, selected-place geography, and outcome geography stay distinct.
- Coverage follows travel: Drive time, walk time, transit, or a real service area beats a radius copied across formats.
- Whitespace and overlap are one decision: A coverage gap and cannibalization of existing branches should both be visible.
- A shortlist is not a forecast: Real estate, finance, and operations still approve an opening.
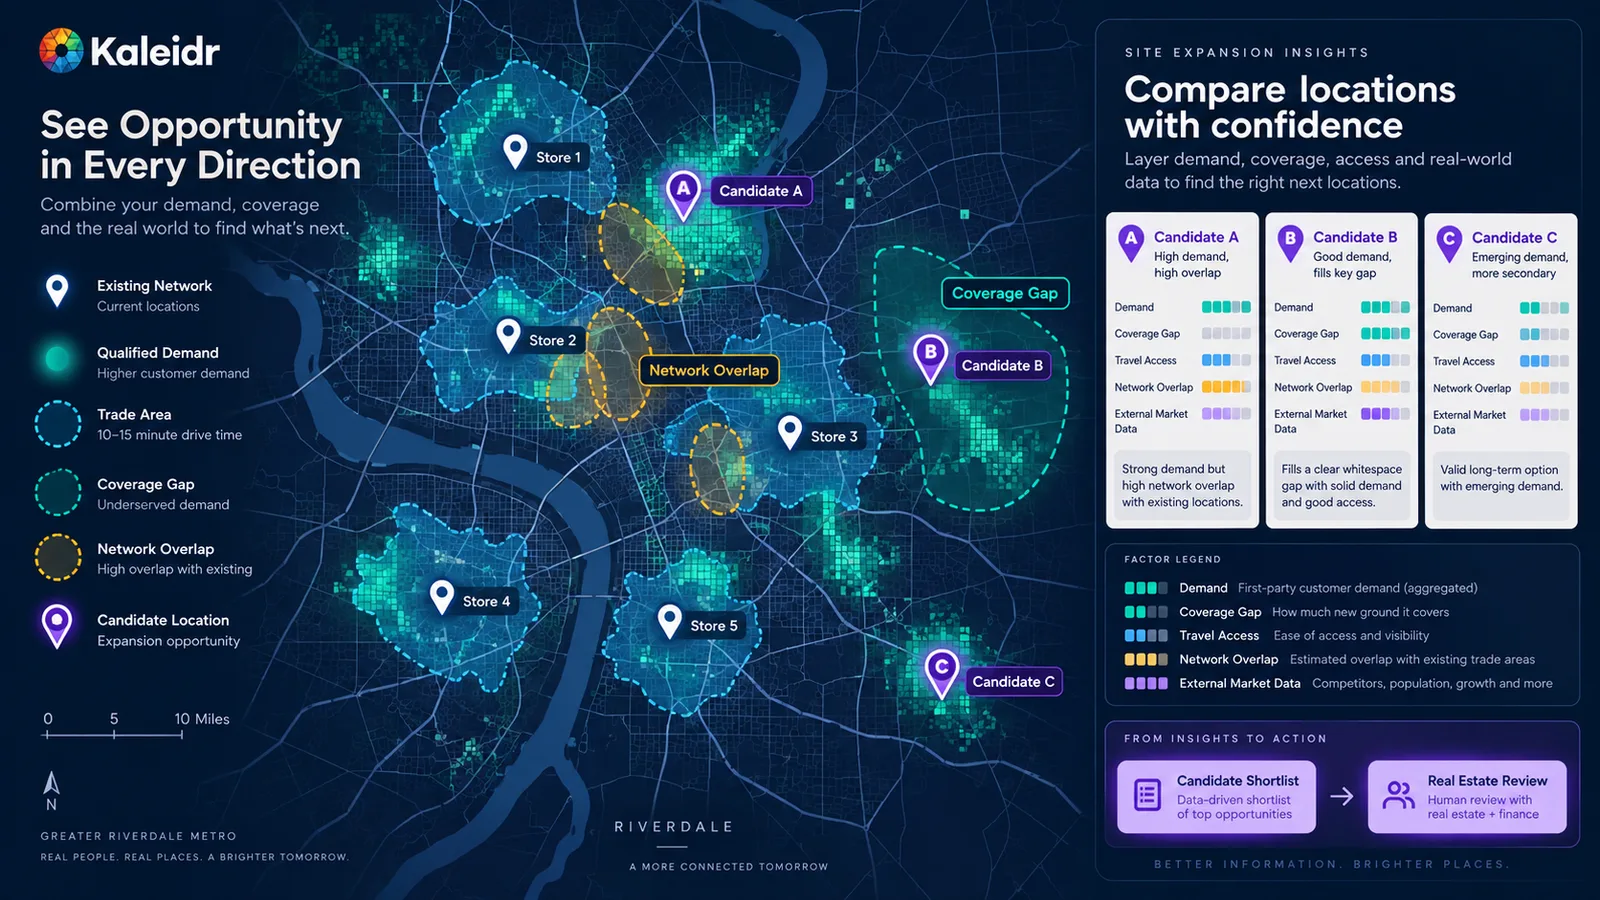
Site-selection analytics should narrow where to investigate—not pretend a map can guarantee the performance of a future location.
Why Is Location Intelligence for Site Selection a Spatial Decision?
A multi-location business can ask where to open next, but a high score on one map layer is not an answer. A candidate can show strong demand and still fail because an existing branch already serves those customers, travel access is poor, the trade area is smaller than a radius suggests, the operating model does not fit, or the property economics do not work. Apparent demand can also be a campaign spike or a seasonal effect. The useful question is which markets and candidate sites deserve deeper investment on a transparent set of spatial and business signals.
Teams often collapse four decisions into one phrase. Market selection asks which cities or territories deserve attention. Trade-area screening asks which submarkets contain attractive demand relative to current coverage, using drive-time zones, service territories, or custom polygons. Candidate-site comparison asks which property or intersection works among a shortlist, once access, visibility, parking, lease economics, zoning, competition, and travel patterns are in view. Portfolio optimization asks whether the business should open, relocate, consolidate, resize, close, or redraw territory boundaries. Spatial analytics can support all four, and the inputs and the cost of a wrong call are not the same.
Spatial AI for multi-location businesses helps a customer choose among branches that already exist. Site-selection analytics helps the operator decide where that network should grow, shrink, or change shape. Location intelligence versus spatial AI separates the geographic decision layer from the language model that queries it. The language model can interpret an analyst's question. Governed data and spatial calculations still have to produce the evidence.
What Should the Existing Network and First-Party Demand Show?
Expansion analysis should start from the network the business already operates. Every location needs one canonical identifier shared by operations, commerce, maps, analytics, and planning, because a branch can move, rename, change format, or temporarily close. Joining systems on the display name alone breaks historical comparison. The useful record also carries status, format, capacity, and the business outcome the company already trusts, such as orders, appointments, bookings, or qualified conversions. Another pin on a map is not a network model.
First-party digital behavior can show where customers already express intent before a new location exists. Store searches, delivery searches, pickup requests, service requests, map exploration, directions requests, and no-result queries are examples. Kaleidr Analytics currently measures how often people view, open, and interact with each place, compares locations on visits and the actions that follow, surfaces clusters and gaps, and turns that activity into signals for product, inventory, and growth teams (Kaleidr, 2026). Those signals can become one evidence layer in a site-selection workflow. Map and place engagement do not replace market data, property diligence, or a financial model.
Search geography is not device geography. A customer in one city can search for service in another, and attributing that demand to the browser location will point expansion at the wrong market. Keep user geography, search geography, selected-place geography, and business-outcome geography distinct. For site selection, the geography of the customer need is usually the more useful one. Grounded spatial AI for business data makes the same separation for other location decisions: the answer has to come from authorized records, not from the language model's memory of a city.
A successful search shows where demand exists. A no-result search can show where the network fails to serve it, if the product stores the reason rather than a bare zero. No nearby location, outside the service area, inventory unavailable, capacity unavailable, travel time too high, and service not offered are different expansion problems. Aggregating those failures can suggest a coverage gap, a service-area problem, an inventory mismatch, or a market that deserves a closer look. The same pattern can support a new branch, a mobile service, a delivery-zone change, a partner, or a redistribution of inventory. Demand minus adequate coverage is a screening signal, not a forecast of revenue.
How Should Coverage, Whitespace, and Cannibalization Be Compared?
A circle of a fixed radius is easy to draw and often a poor picture of access. Roads, rivers, bridges, transit, highways, and the service boundary change who can actually reach a site. A trade area that matches the business might be a short drive, a walk, a transit ride, a service polygon, or a historical catchment. A coffee shop, a specialty clinic, a destination retailer, and a hotel do not share one catchment, and a hotel is shaped by airports, venues, and visitor flows rather than a residential radius. Do not copy one trade-area rule across every format.
Historical catchments come from observed outcomes, such as aggregated origin regions, delivery areas, booking markets, or directions behavior. Modeled catchments come from a travel-time or service-area rule and are easier to compare consistently. Observed catchments can be more realistic and can also inherit the bias of the current network, because customers only appear where the business already operates. Many teams keep both and label which one a map is showing. Coverage that ignores travel will treat a nearby-but-slow site as more accessible than a farther site on a direct route.
Whitespace is geographic opportunity the current network does not adequately serve: qualified demand and market attractiveness, minus existing coverage and competitive pressure. The formula belongs to the business. Cannibalization is the other side of the same decision. A new site can extend coverage and still take demand from an existing branch through travel-time overlap, catchment overlap, or search-area overlap. High overlap is not automatically a reason to reject a site, because some formats intentionally run dense networks. The planning requirement is to make the overlap visible before anyone treats whitespace as proof that a location will perform.
The comparison below is editorial. Real deployments should fill the same columns from the network and the demand feed they already operate. Neither column is a recommended winner. Candidate A may serve more immediate demand and still cannibalize nearby branches. Candidate B may fill a gap with less overlap and more unmet no-result demand. The right choice depends on whether the strategy is density or coverage.
| Signal | Candidate A | Candidate B |
|---|---|---|
| Qualified local demand | High | Medium |
| Existing network overlap | High | Low |
| Customer travel time | Shorter | Longer |
| Competitor presence | Medium | Low |
| First-party no-result demand | Medium | High |
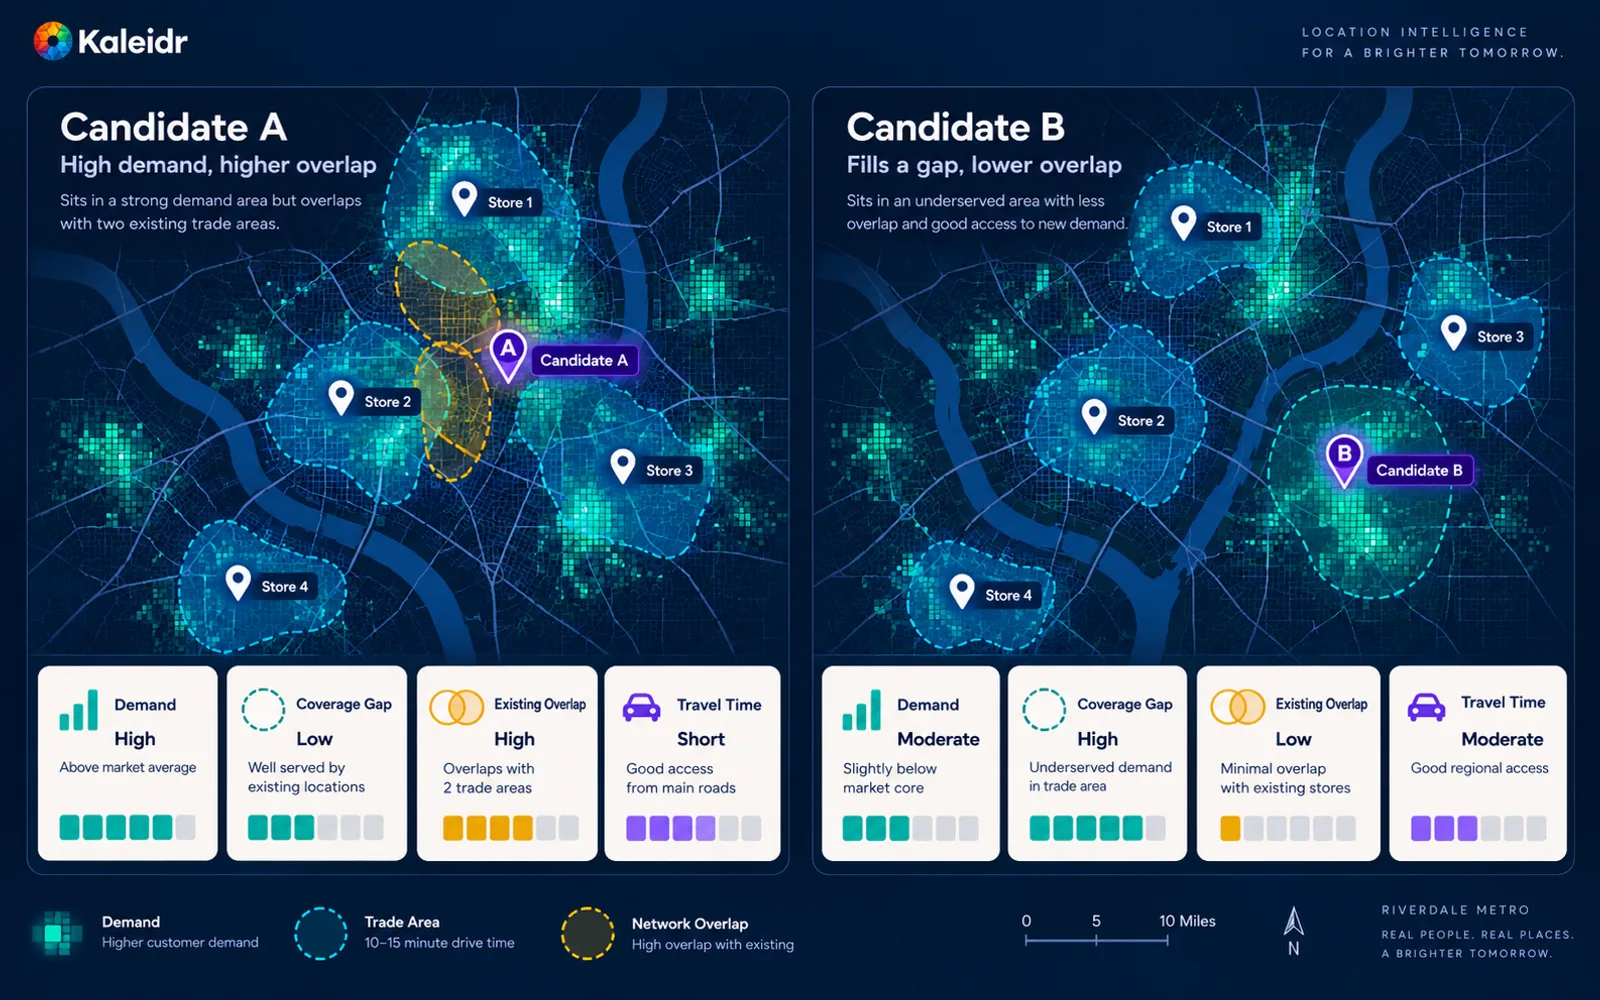
Whitespace and cannibalization describe different sides of the same network decision; the right choice depends on business strategy, not one universal score.
Where Do External Market Data and Kaleidr Fit?
First-party behavior should not replace market data. Population, daytime population, employment, mobility, competition, co-tenants, access, rents, zoning, hazards, and the development pipeline can all change whether a shortlist is worth a property search. Esri's retail site-suitability guidance says analysts can use geoprocessing on customer traffic, footfall, demographics, and household income to evaluate and score potential sites, and it lists competitive analysis among those decision inputs (Esri, 2026). That page describes Esri's own retail workflow. A vendor account of its tools is not a Kaleidr scoring model, and a demographic layer by itself does not select a site.
CBRE Retail Analytics describes data-science modeling for market planning and site selection, and its trade-area guidance says no single data source or methodology is sufficient: useful catchments combine sources with strategic consideration unique to each business (CBRE, 2026). The same page names white space analysis and a review of how existing units affect one another. CARTO's site-selection materials describe whitespace analysis aimed at avoiding cannibalization, trade areas set against the store network and competitors, and the combination of internal data with external streams such as foot traffic (CARTO, 2026). Those passages describe each vendor's own product. External market data still belongs in the decision, under the license and method the provider actually grants.
Every spatial feature should keep its source, update time, geographic unit, method, and known limitation. Raw search counts mislead, because a larger market can produce more queries without a higher rate of qualified intent. Compare rates, such as qualified searches per session, no-result searches per qualified search, and selections per eligible result, and normalize external layers by population, households, area, or employment when the comparison requires it. Grouping the same demand by ZIP code, tract, neighborhood, hexagon, or drive-time polygon can change the apparent pattern. The modifiable areal unit problem is that dependence on how the areas are drawn (Openshaw, 1984). Test whether a pattern survives a second reasonable aggregation before treating an administrative boundary as a market.
Kaleidr's public Analytics page does not document a turnkey demographic catalog, foot-traffic dataset, lease database, zoning engine, revenue forecast, or automated site approval. Those inputs, when a workflow needs them, come from the host or from an approved external provider. Kaleidr Enterprise currently describes location-intelligence infrastructure with inference APIs, ranking systems, analytics, and deployment support for spatial products (Kaleidr, 2026). A practical architecture is therefore first-party systems, licensed market data, spatial calculations, and a Kaleidr analytics or enterprise layer inside an internal expansion application. The host still owns the site model, the data licenses, the financial assumptions, the real-estate diligence, and the investment approval.
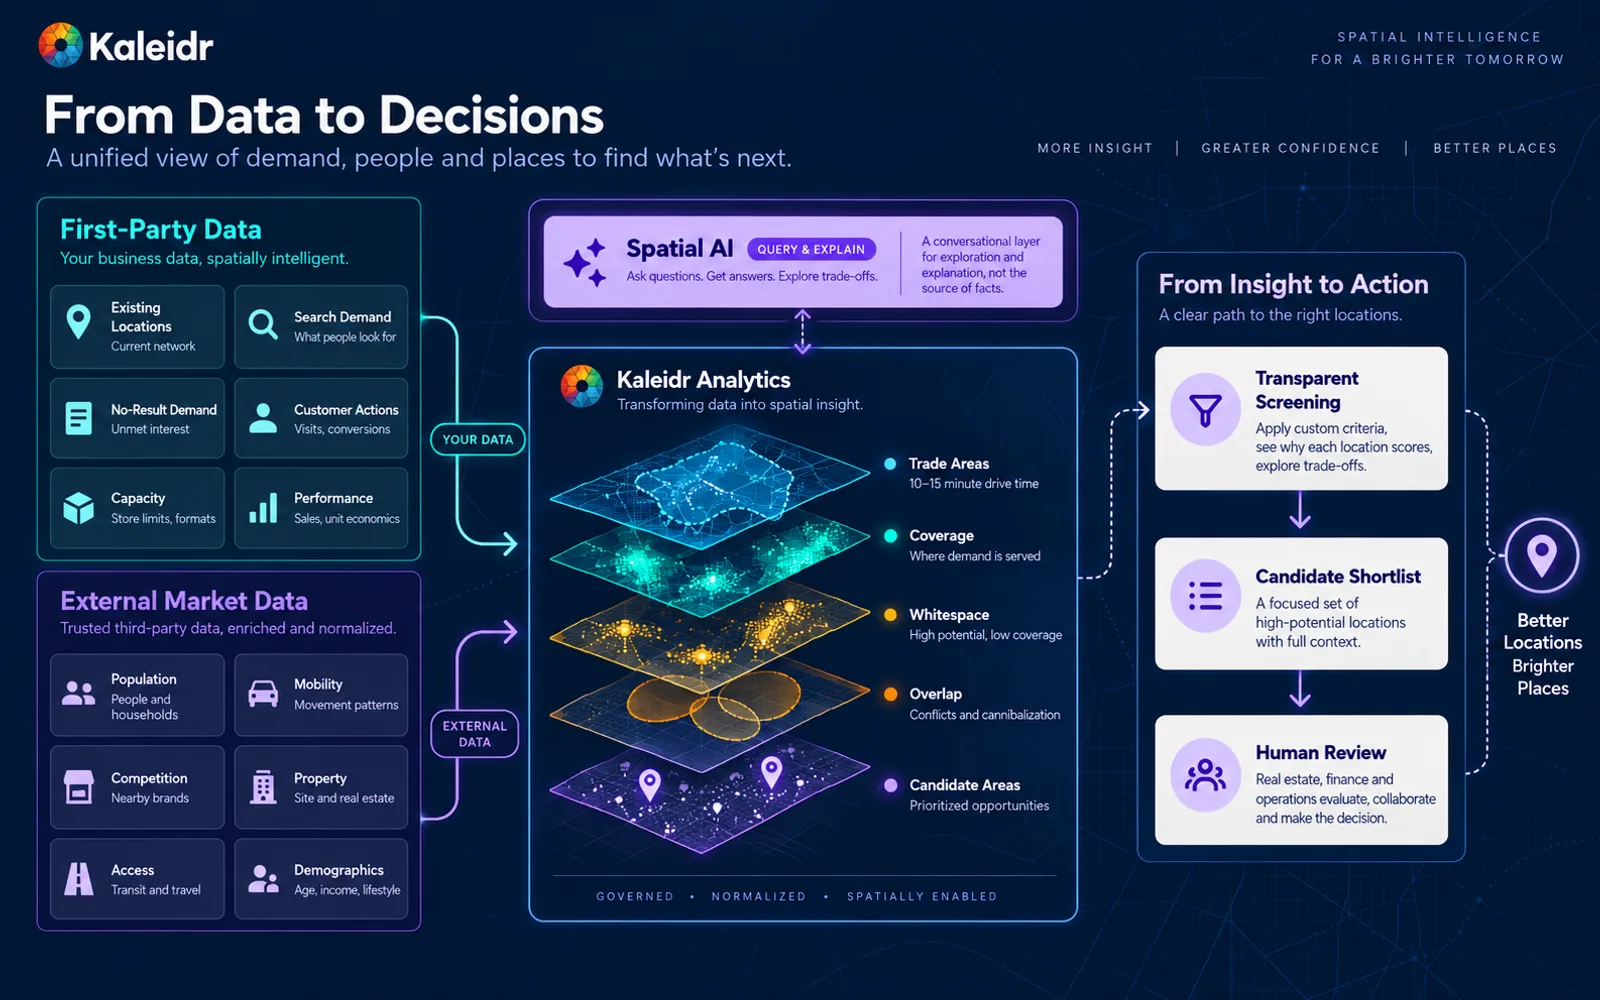
Expansion decisions need multiple governed data sources; Spatial AI can help query and explain the analysis without inventing the market facts.
How Should Teams Pilot, Measure, and Keep the Shortlist Honest?
A ranked shortlist says which candidates fit the stated screening criteria better than the alternatives. A forecast says a site is expected to produce a specific future outcome, and that claim needs historical openings, comparable performance, lease economics, seasonality, competition, and an operating model. Do not present map engagement as a prediction of store revenue. An illustrative score can weight demand fit, coverage gap, accessibility, and overlap as separate terms, but the weights are business policy and should be versioned when they change. A committee should see the components. A single unexplained total is much harder to govern.
If the company has historical openings, a backtest asks whether the same rules would have ranked them sensibly using only information available before opening. Training only on branches that survived will not show why rejected or closed sites failed, so closed, relocated, and declined candidates belong in the record when the company still has them. Existing-location performance is not pure site quality, because marketing spend, lease terms, brand awareness, and operations can move the outcome, so the location effect should stay separate from the operational effect as far as the data allows. After a site opens, compare the original assumption with actual place engagement and the business outcome, then update the next cycle. Spatial analytics versus web analytics explains why a session count cannot answer that geographic question, and dashboard KPIs for map products covers the measurement architecture those signals sit in.
New locations should be compared with a cohort of similar age, not with a store that has been open for years. The same evidence can surface consolidation candidates when overlap is high, unique demand is low, and a nearby branch has capacity, but a closure still needs human and financial review. Franchise territories should not be drawn to look equal in area, because equal square mileage is not equal opportunity. Clinics, hospitality portfolios, pickup hubs, and marketplaces can use the same demand, coverage, access, and capacity pattern even when the expansion unit is a service zone or a city rather than a storefront. Exact customer origins are a poor planning layer: aggregate to a region, trade area, or travel-time band, suppress very small cells, and do not build a heatmap of home addresses.
A practical pilot asks which submarkets in one metro deserve a property search for the next few locations. Load the active network with stable identifiers and a trusted outcome, aggregate qualified searches and no-result reasons, calculate travel-time coverage and overlap, and add only the external variables the hypothesis needs. Produce a shortlist of markets, not a lease. Expansion and real-estate teams then check property economics, operations, brand strategy, and local conditions. Measure time to a shortlist, override rate, stability, and whether the shortlist can be explained and backtested, rather than layer count or the number of analyst questions. An enterprise Spatial AI pilot uses the same discipline: prove one job before scaling the workflow.

The strongest site-selection system learns after opening: compare the original assumptions with actual customer behavior and business outcomes before the next expansion cycle.
The following mistakes are editorial. Real teams should fill the same columns from the network, the demand feed, and the market data they already govern. A spatial screen that hides its components will not survive a finance review.
| Mistake | Result | Better approach |
|---|---|---|
| Use raw search counts | Larger markets look artificially strong | Compare rates, not raw totals |
| Attribute demand to the device | Search geography points at the wrong city | Separate user, search, and outcome geography |
| Use a radius as the trade area | Access is distorted | Use travel time or a real service area |
| Treat whitespace as guaranteed opportunity | False confidence | Keep it as a screening signal |
| Hide network overlap | Cannibalization stays invisible | Show coverage of existing locations |
| Publish one score with no components | Governance weakens | Expose the inputs and the weights |
| Call a ranking a forecast | The model overclaims | Separate the shortlist from prediction |
| Train only on open stores | Failures never enter the record | Keep closures and rejected candidates |
| Store exact customer origins | Privacy risk grows | Aggregate demand |
| Assume Kaleidr supplies demographics or foot traffic | The product claim is wrong | Bring approved external data |
Explore Kaleidr Analytics to compare place engagement and spatial patterns on maps the business already runs. Explore Kaleidr Enterprise to connect that evidence to inference APIs, ranking, and deployment support. The expansion decision still belongs to the teams that own the network, the lease, and the financial model.
FAQs
What is location intelligence for site selection?
Location intelligence for site selection combines an existing network, customer demand, trade areas, accessibility, competition, and approved market data to screen where a business might expand. A shortlist still needs financial, operational, and real-estate review.
What is site selection analytics?
Site selection analytics compares potential markets or physical sites with a consistent, documented set of spatial and business criteria. The comparison is a screening method, not an automatic approval to open.
What is whitespace analysis?
Whitespace analysis looks for geographic areas where qualified demand appears underserved by the current location network. The result is a reason to investigate, not proof that a new site will be profitable.
What is cannibalization in site selection?
Cannibalization occurs when a new location captures demand that would otherwise go to an existing location. Travel-time overlap, catchment overlap, and search-area overlap can make that risk visible before opening.
Should site selection use a radius or drive time?
Use the geography that matches how customers actually reach the business. Drive time, walk time, transit access, a service polygon, or a historical catchment is usually more realistic than one radius copied across every format.
Can customer map searches help choose new locations?
Aggregated, qualified search and no-result behavior can be a useful first-party demand signal when the search geography is kept separate from the device and the reason for an empty result is stored. Those signals should sit beside external market and property data, not replace them.
Is a site score the same as a revenue forecast?
No. A site score ranks candidates against criteria the business defined. A revenue forecast claims a future business outcome and needs historical openings, financial assumptions, and a validation plan.
Can Spatial AI choose the next site automatically?
A safer architecture uses the language model to interpret questions and explain governed spatial analysis. Final expansion decisions stay with the business and its real-estate, finance, and operations teams.
How can Kaleidr Analytics support site selection?
Kaleidr currently describes Analytics around map and place engagement, comparing locations, identifying spatial patterns, and turning activity into product, inventory, and growth decisions. Those first-party signals can contribute to a broader site-selection process.
Does Kaleidr provide demographic or foot-traffic data for site selection?
Kaleidr's current public Analytics and Enterprise pages do not document a turnkey demographic or foot-traffic catalog. Those datasets should come from the business or an approved external provider unless a specific enterprise integration says otherwise.
Can site-selection analytics work outside retail?
Yes. Demand, coverage, accessibility, and capacity can support clinics, hospitality, marketplaces, branches, coworking, logistics hubs, and other location-dependent networks. The features should match the business model.
What should an expansion pilot measure?
Measure whether the workflow produces a faster, explainable, and historically defensible shortlist. Layer count and the number of analyst questions are weak success metrics.
References
- Kaleidr. Map Engagement and Location Analytics. Accessed 22 September 2026. https://kaleidr.com/analytics
- Kaleidr. Location Intelligence APIs and Map SDK. Accessed 22 September 2026. https://kaleidr.com/enterprise
- Esri. Retail Store Location Analysis | Retail Site Suitability & Selection. Accessed 22 September 2026. https://www.esri.com/en-us/industries/retail/strategies/site-suitability
- CBRE. CBRE Retail Analytics. Accessed 22 September 2026. https://www.cbre.com/services/transform-business-outcomes/retail-analytics
- CARTO. Site Selection with Location Intelligence. Accessed 22 September 2026. https://carto.com/solutions/site-selection/
- Kaleidr. Spatial AI for Multi-Location Businesses. Accessed 22 September 2026. https://kaleidr.com/blog/spatial-ai-for-multi-location-businesses
- Kaleidr. Location Intelligence vs. Spatial AI. Accessed 22 September 2026. https://kaleidr.com/blog/location-intelligence-vs-spatial-ai
- Kaleidr. Spatial Analytics vs. Web Analytics. Accessed 22 September 2026. https://kaleidr.com/blog/spatial-analytics-vs-web-analytics
- Kaleidr. Spatial Analytics Dashboard KPIs for Map Products. Accessed 22 September 2026. https://kaleidr.com/blog/spatial-analytics-dashboard-kpis-for-map-products
- Kaleidr. Grounded Spatial AI for Business Data. Accessed 22 September 2026. https://kaleidr.com/blog/grounded-spatial-ai-business-data
- Kaleidr. Enterprise Spatial AI Pilot Before Scaling. Accessed 22 September 2026. https://kaleidr.com/blog/enterprise-spatial-ai-pilot-before-scaling
- Openshaw, S. The Modifiable Areal Unit Problem. Concepts and Techniques in Modern Geography 38. Geo Books, 1984. https://github.com/qmrg/CATMOG/blob/Main/38-maup-openshaw.pdf
@misc{kaleidr_analytics_site_selection_2026,
  title  = {Map Engagement and Location Analytics},
  author = {{Kaleidr}},
  year   = {2026},
  note   = {Accessed 22 September 2026},
  url    = {https://kaleidr.com/analytics}
}

@misc{kaleidr_enterprise_site_selection_2026,
  title  = {Location Intelligence APIs and Map SDK},
  author = {{Kaleidr}},
  year   = {2026},
  note   = {Accessed 22 September 2026},
  url    = {https://kaleidr.com/enterprise}
}

@misc{esri_site_suitability_2026,
  title  = {Retail Store Location Analysis | Retail Site Suitability \& Selection},
  author = {{Esri}},
  year   = {2026},
  note   = {Accessed 22 September 2026},
  url    = {https://www.esri.com/en-us/industries/retail/strategies/site-suitability}
}

@misc{cbre_retail_analytics_2026,
  title  = {CBRE Retail Analytics},
  author = {{CBRE}},
  year   = {2026},
  note   = {Accessed 22 September 2026},
  url    = {https://www.cbre.com/services/transform-business-outcomes/retail-analytics}
}

@misc{carto_site_selection_2026,
  title  = {Site Selection with Location Intelligence},
  author = {{CARTO}},
  year   = {2026},
  note   = {Accessed 22 September 2026},
  url    = {https://carto.com/solutions/site-selection/}
}

@misc{kaleidr_multi_location_2026,
  title  = {Spatial AI for Multi-Location Businesses},
  author = {{Kaleidr}},
  year   = {2026},
  note   = {Accessed 22 September 2026},
  url    = {https://kaleidr.com/blog/spatial-ai-for-multi-location-businesses}
}

@misc{kaleidr_li_vs_spatial_ai_2026,
  title  = {Location Intelligence vs. Spatial AI},
  author = {{Kaleidr}},
  year   = {2026},
  note   = {Accessed 22 September 2026},
  url    = {https://kaleidr.com/blog/location-intelligence-vs-spatial-ai}
}

@misc{kaleidr_spatial_vs_web_2026,
  title  = {Spatial Analytics vs. Web Analytics},
  author = {{Kaleidr}},
  year   = {2026},
  note   = {Accessed 22 September 2026},
  url    = {https://kaleidr.com/blog/spatial-analytics-vs-web-analytics}
}

@misc{kaleidr_dashboard_kpis_2026,
  title  = {Spatial Analytics Dashboard KPIs for Map Products},
  author = {{Kaleidr}},
  year   = {2026},
  note   = {Accessed 22 September 2026},
  url    = {https://kaleidr.com/blog/spatial-analytics-dashboard-kpis-for-map-products}
}

@misc{kaleidr_grounded_spatial_ai_2026,
  title  = {Grounded Spatial AI for Business Data},
  author = {{Kaleidr}},
  year   = {2026},
  note   = {Accessed 22 September 2026},
  url    = {https://kaleidr.com/blog/grounded-spatial-ai-business-data}
}

@misc{kaleidr_enterprise_pilot_2026,
  title  = {Enterprise Spatial AI Pilot Before Scaling},
  author = {{Kaleidr}},
  year   = {2026},
  note   = {Accessed 22 September 2026},
  url    = {https://kaleidr.com/blog/enterprise-spatial-ai-pilot-before-scaling}
}

@book{openshaw_maup_1984,
  title     = {The Modifiable Areal Unit Problem},
  author    = {Openshaw, S.},
  year      = {1984},
  series    = {Concepts and Techniques in Modern Geography},
  number    = {38},
  publisher = {Geo Books},
  url       = {https://github.com/qmrg/CATMOG/blob/Main/38-maup-openshaw.pdf}
}