
Digital mapping turns geographic information into a computer-readable map that can be searched, styled, updated, analyzed, and interacted with. Unlike a printed map, a digital map can combine layers, change by zoom or user input, retrieve data from APIs, show live updates, and support filtering, routing, measuring, or location questions. Modern systems usually combine geographic data, a coordinate reference, sources and layers, a style, a renderer, and delivery infrastructure such as APIs or map tiles.
The sections below cover stack components, vector versus raster data, tiles, browser loading, GIS and web-mapping boundaries, where spatial AI fits, Kaleidr surfaces, accessibility, and common mistakes. Related product context lives on Kaleidr Studio and Kaleidr Spatial AI. For the AI category taxonomy, see AI Mapping.
Digital mapping essentials
- Stack, not image: Separate data, coordinates, layers, style, tiles, renderer, and application logic.
- Vector and raster: Discrete features versus continuous grids; many products combine both.
- Tiles scale delivery: Request only the geographic pieces needed for the current view.
- AI interprets; data decides: Ground answers on authorized place and business records.
- Measure tasks: Place selection and useful actions beat map-open counts.
What Is Digital Mapping?
Digital mapping converts information about places and geographic features into a map that software can store, process, display, and update. Underlying records can describe places, roads, buildings, parcels, boundaries, terrain, imagery, stores, routes, weather, vehicles, population, customer activity, or environmental conditions. The U.S. Geological Survey distinguishes two fundamental forms of geographic representation: raster data stored as rows, columns, and cell values, and vector data stored as points, lines, and polygons (Feature representation). A digital map is therefore usually a rendered view of structured geographic data rather than a single picture of geography.
| Capability | Static map | Interactive digital map |
|---|---|---|
| Pan and zoom | No | Yes |
| Search and filters | No | Usually |
| Change visible layers | No | Yes |
| Update data independently | Requires a new map | Possible |
| Connect to APIs | No | Yes |
| Ask contextual AI questions | No | Possible |
A PNG exported from a mapping tool is digital media, but it does not provide the same behavior as an interactive map. For product teams, the interactive version is an application surface rather than only a graphic.
What Are the Core Components of a Digital Map?
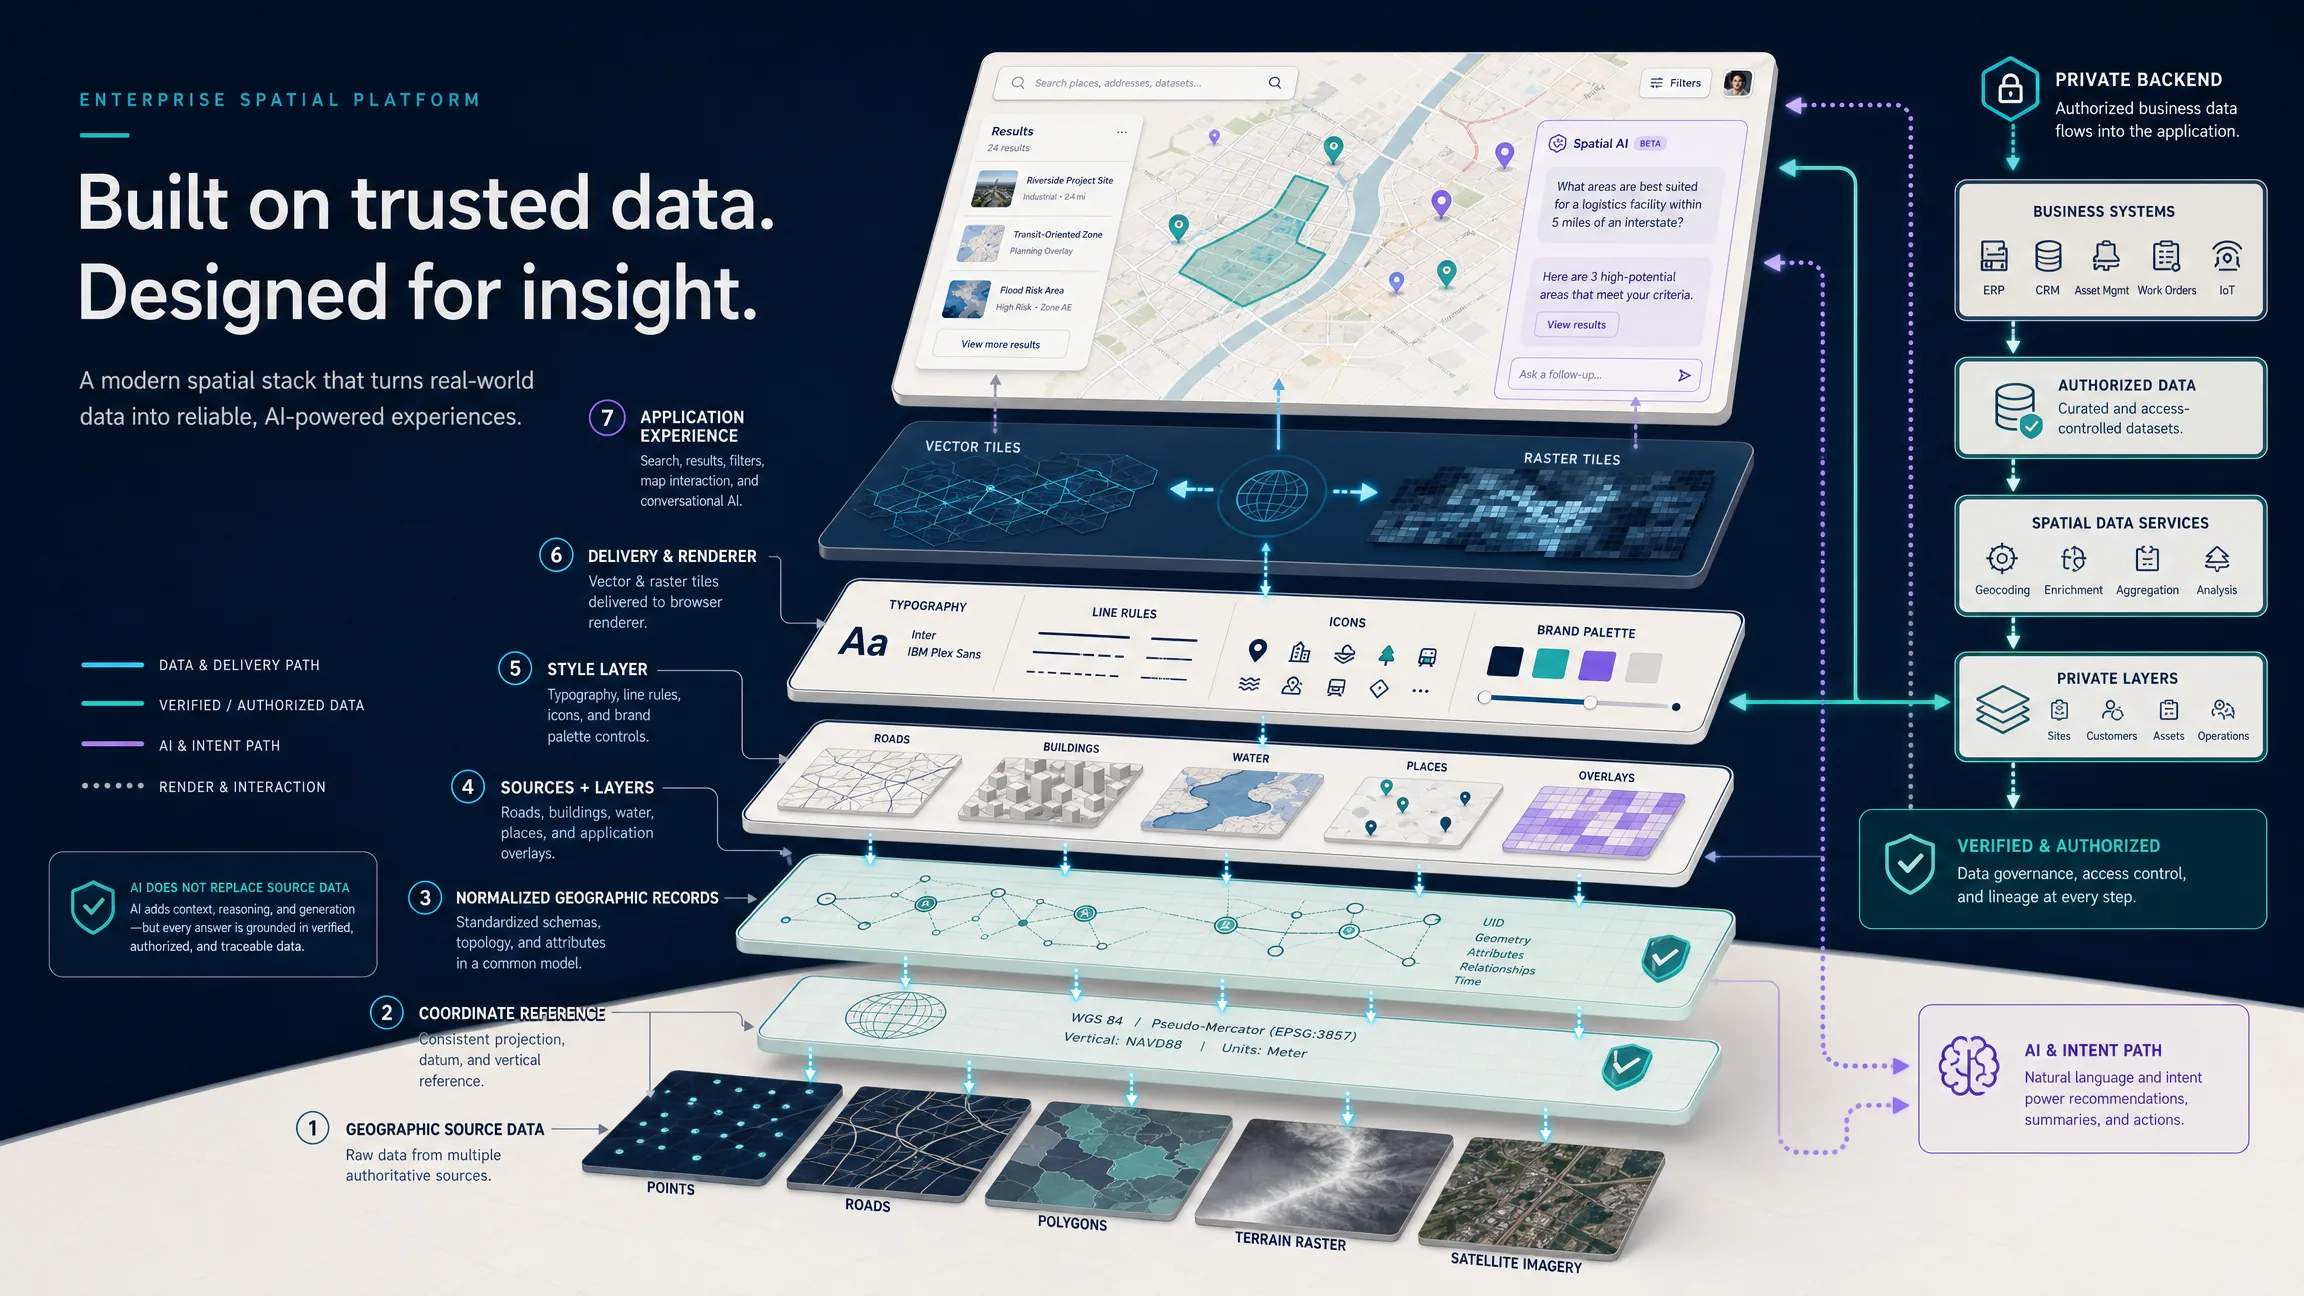
Most modern digital mapping systems can be understood as six layers: geographic data, coordinate reference, sources and layers, style, renderer, and interactive application. Production systems usually add APIs, tile delivery, caching, analytics, authentication, and business logic around those components. Coordinates only make sense when their reference system is known; never assume two numeric columns are compatible merely because both contain numbers. Validate coordinate order, valid ranges, reference system, units, source, and precision. The companion guide Search Location Using Latitude and Longitude covers coordinate-order and lookup workflows in more depth.
ArcGIS documentation describes a layer as a collection of geographic data that references a source, with points, lines, polygons, surfaces, imagery, or other spatial representations drawn according to the layer’s properties (Layers). Layers make the map composable: the application can turn a layer on or off, filter it, style it, query features, change drawing order, update the source, or respond to interaction. The MapLibre Style Specification likewise describes a style as a document that determines what data to draw, the order in which to draw it, and how the data should be rendered. Geographic data can stay the same while visual interpretation changes, which is why branded map systems can reuse one location dataset across multiple visual identities.
{
  "id": "store_123",
  "name": "Example Store",
  "longitude": -73.9857,
  "latitude": 40.7484,
  "category": "retail",
  "open": true
}
How Do Vector and Raster Data Differ?
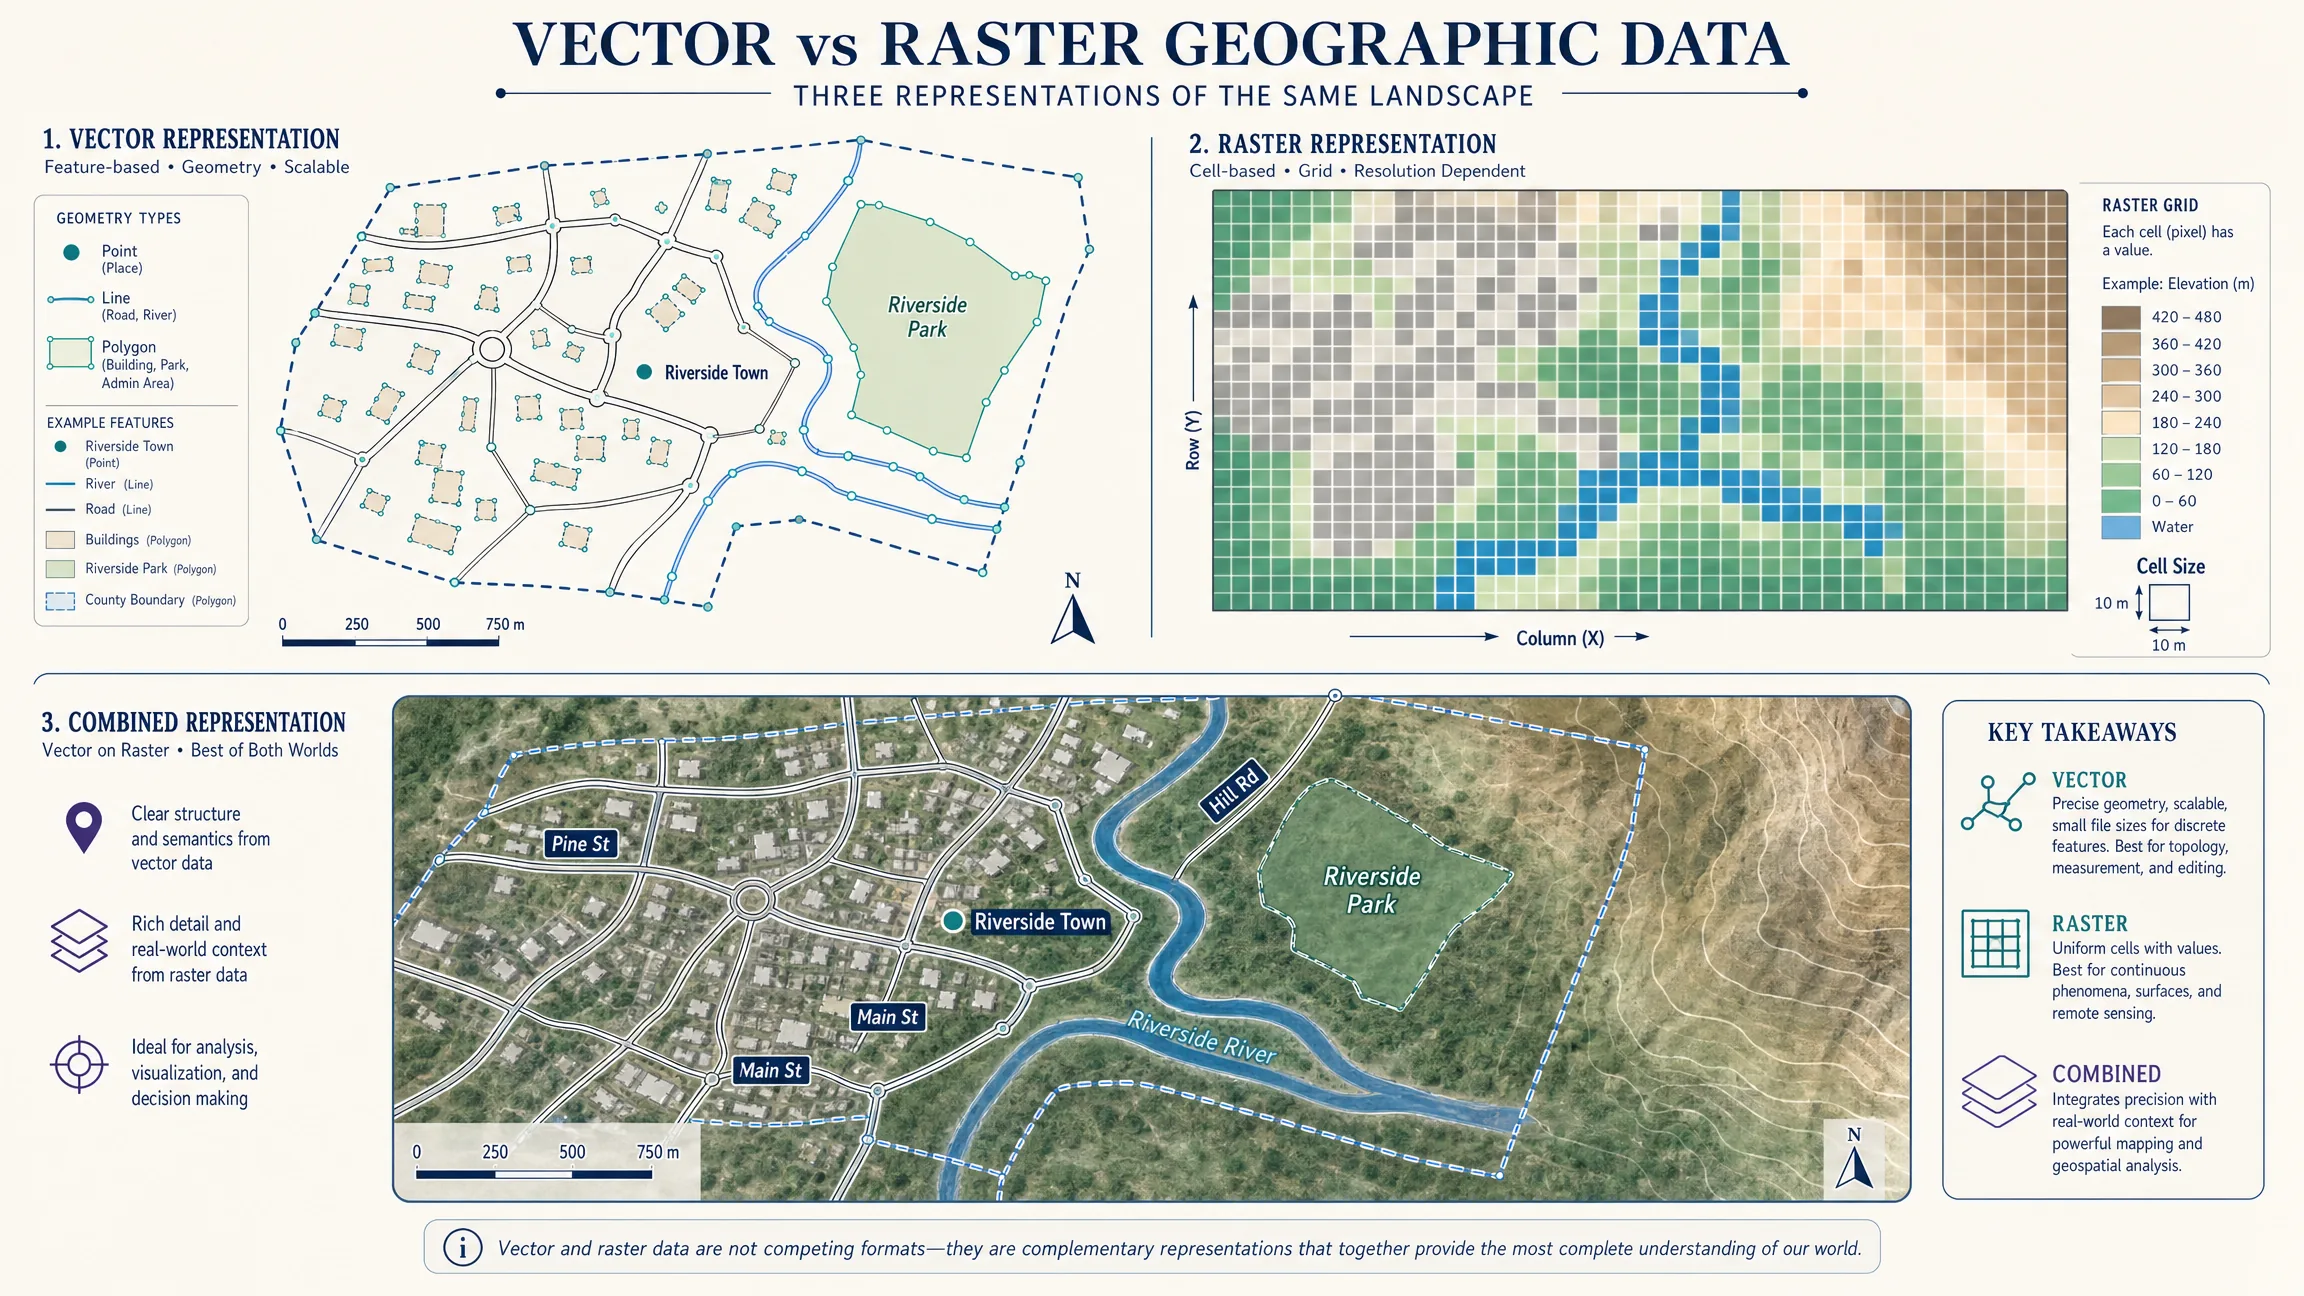
Vector data represents discrete geographic features with points, lines, and polygons—useful when the application needs to select features, inspect attributes, restyle objects, filter categories, perform geometric operations, or render cleanly across zoom levels. Raster data represents space as a grid of cells or pixels—useful for satellite imagery, aerial photography, elevation, temperature, rainfall, and land-cover classification. A modern digital map often combines both: raster imagery or terrain under vector roads, parcels, and store markers.
What Are Map Tiles and How Do They Reach the Browser?
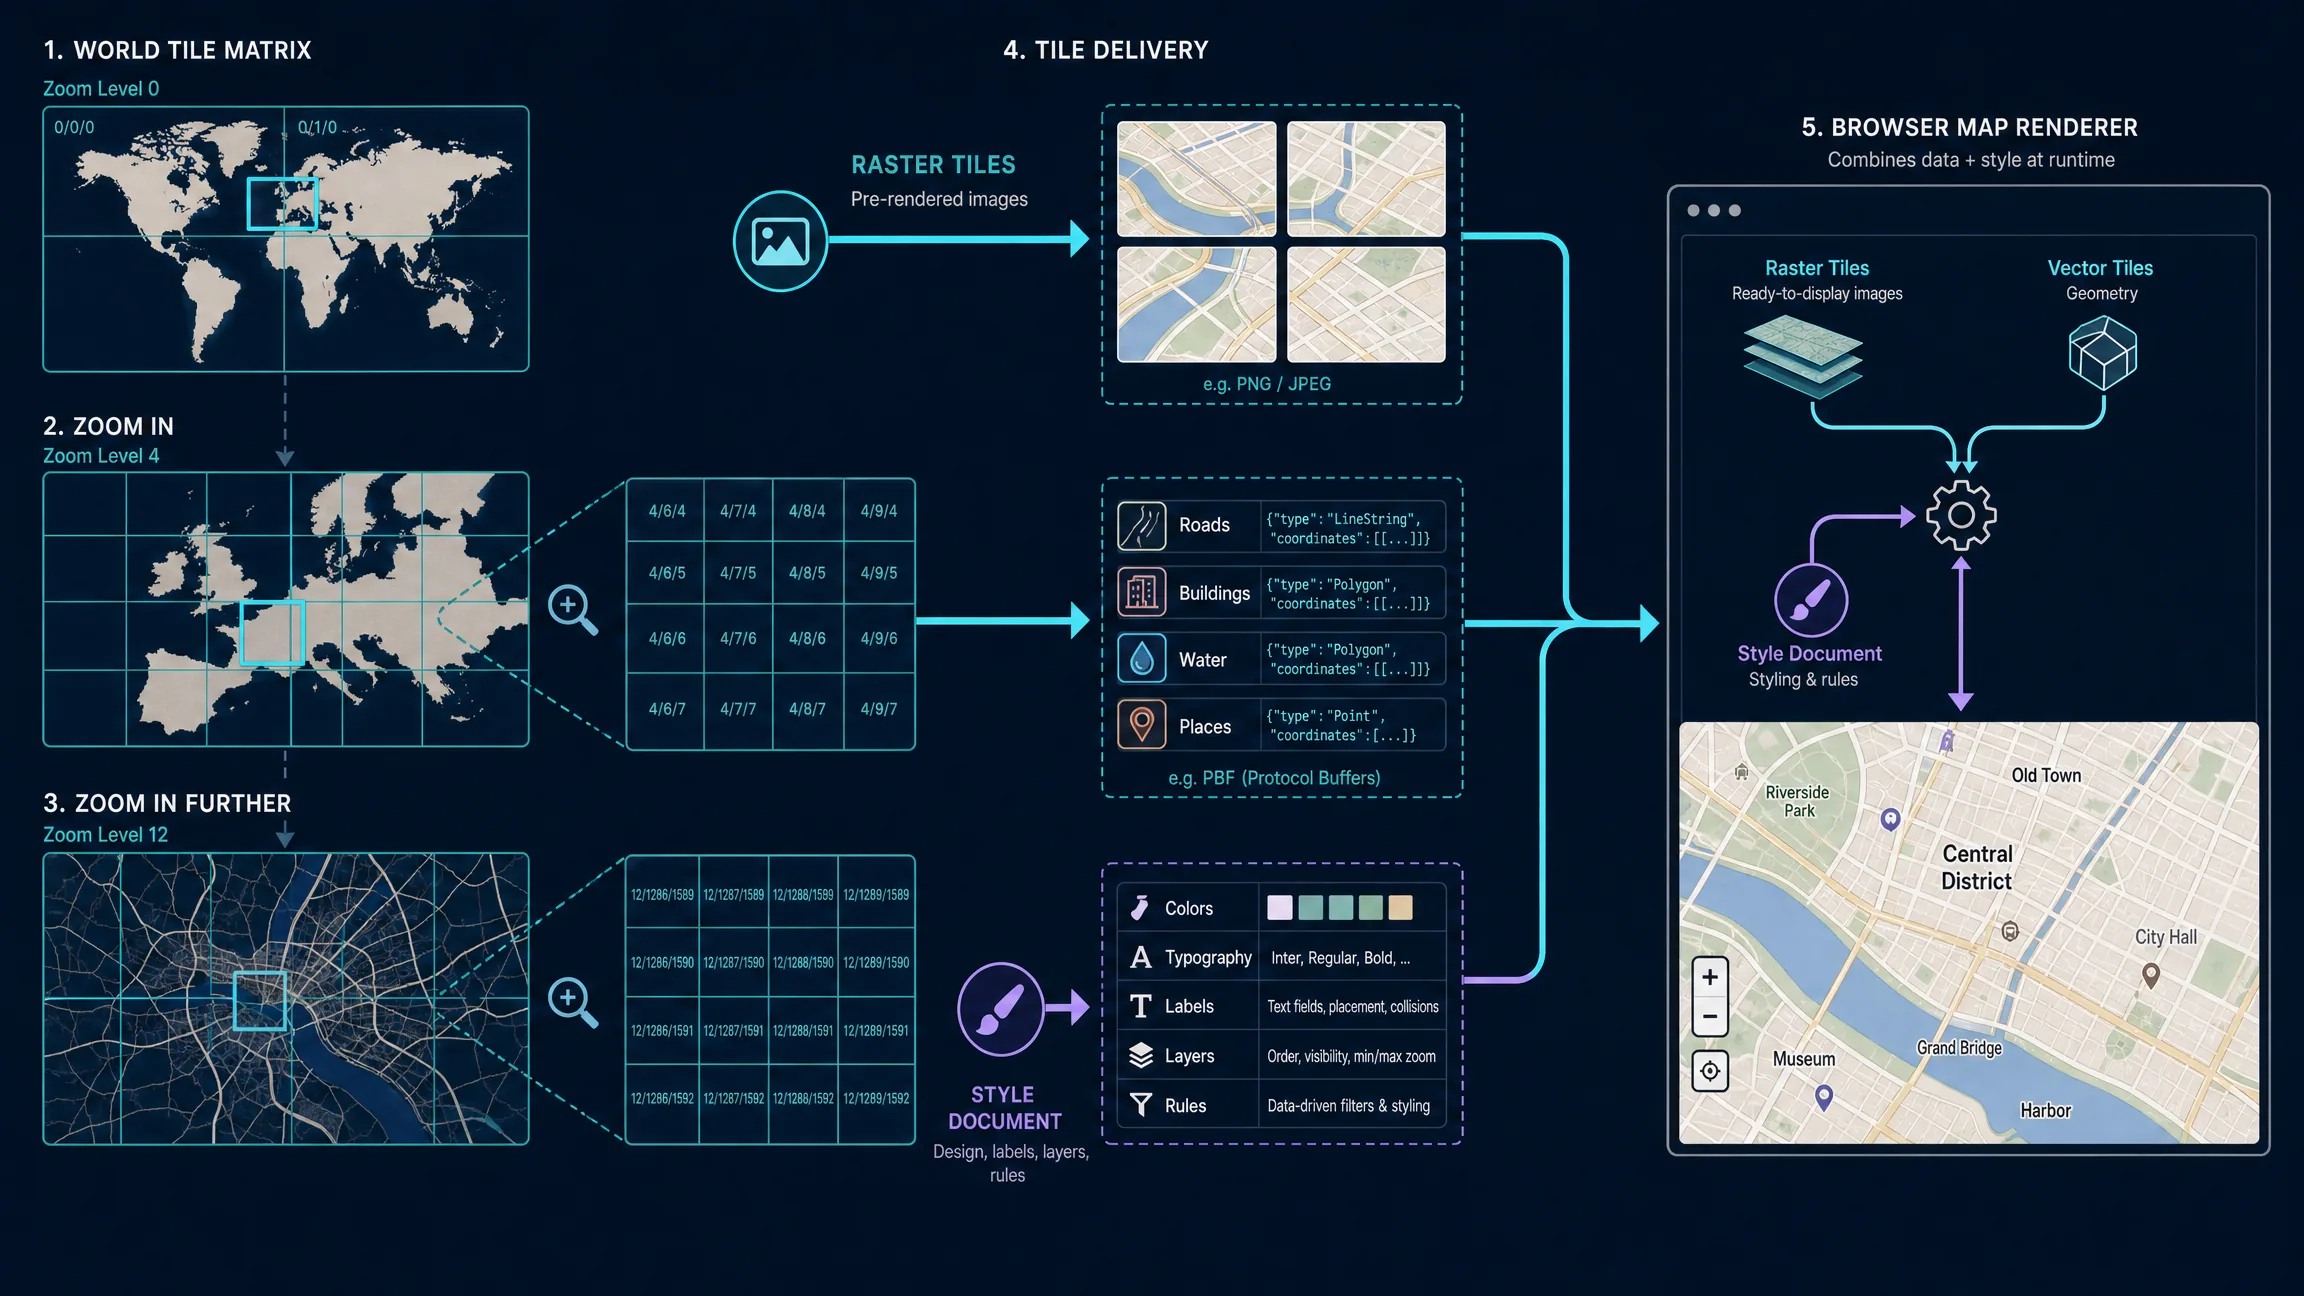
A global map contains too much information to send as one file every time a user opens a page. Tiling divides geographic content into smaller spatial chunks so the application requests only the pieces needed for the current view. The Open Geospatial Consortium’s Web Map Tile Service standard describes a way to serve digital maps through predefined image tiles (WMTS), and OGC API — Tiles extends the model to web APIs that can provide map tiles, vector feature tiles, coverage tiles, and other tiled geospatial information. Raster tiles are pre-rendered images with simple client rendering and predictable appearance; changing the look usually requires another rendered tile set. Vector tiles contain encoded geographic features so the client can apply style at runtime—useful for flexible branding, crisp rendering, and data-driven presentation.
MapLibre GL JS is a TypeScript library that uses WebGL to render interactive maps from vector tiles in a browser, with a Map object that manages styles, layers, events, and camera interaction. A simplified startup sequence loads the page, initializes the mapping library, resolves the style and sources, requests tiles and related resources, draws visible geography, adds application layers, and then responds to pan, search, filter, or selection events. Use production map data and style resources you are authorized to serve.
import maplibregl from "maplibre-gl";

const map = new maplibregl.Map({
  container: "map",
  style: "https://demotiles.maplibre.org/globe.json",
  center: [-73.9857, 40.7484],
  zoom: 11
});
How Does Digital Mapping Differ From GIS and Web Mapping?
A digital map is a computer-readable map or interactive map experience. A geographic information system, according to the U.S. Geological Survey, is a computer system for analyzing and displaying geographically referenced information (What is a GIS?). GIS usually describes a broader analytical environment that can include data management, editing, spatial analysis, projections, geoprocessing, modeling, and mapping. Digital mapping may use GIS data and methods without requiring a full GIS workflow—for example, a consumer store locator is a digital map even when GIS tools operate behind the scenes. Digital mapping is also broader than web mapping: it includes desktop, mobile, embedded, offline, dashboard, and navigation maps. Web mapping is the subset delivered through web technologies; OGC API — Maps defines web API operations for discovering and retrieving maps independently of the underlying data store.
Where Does AI Fit in Digital Mapping?
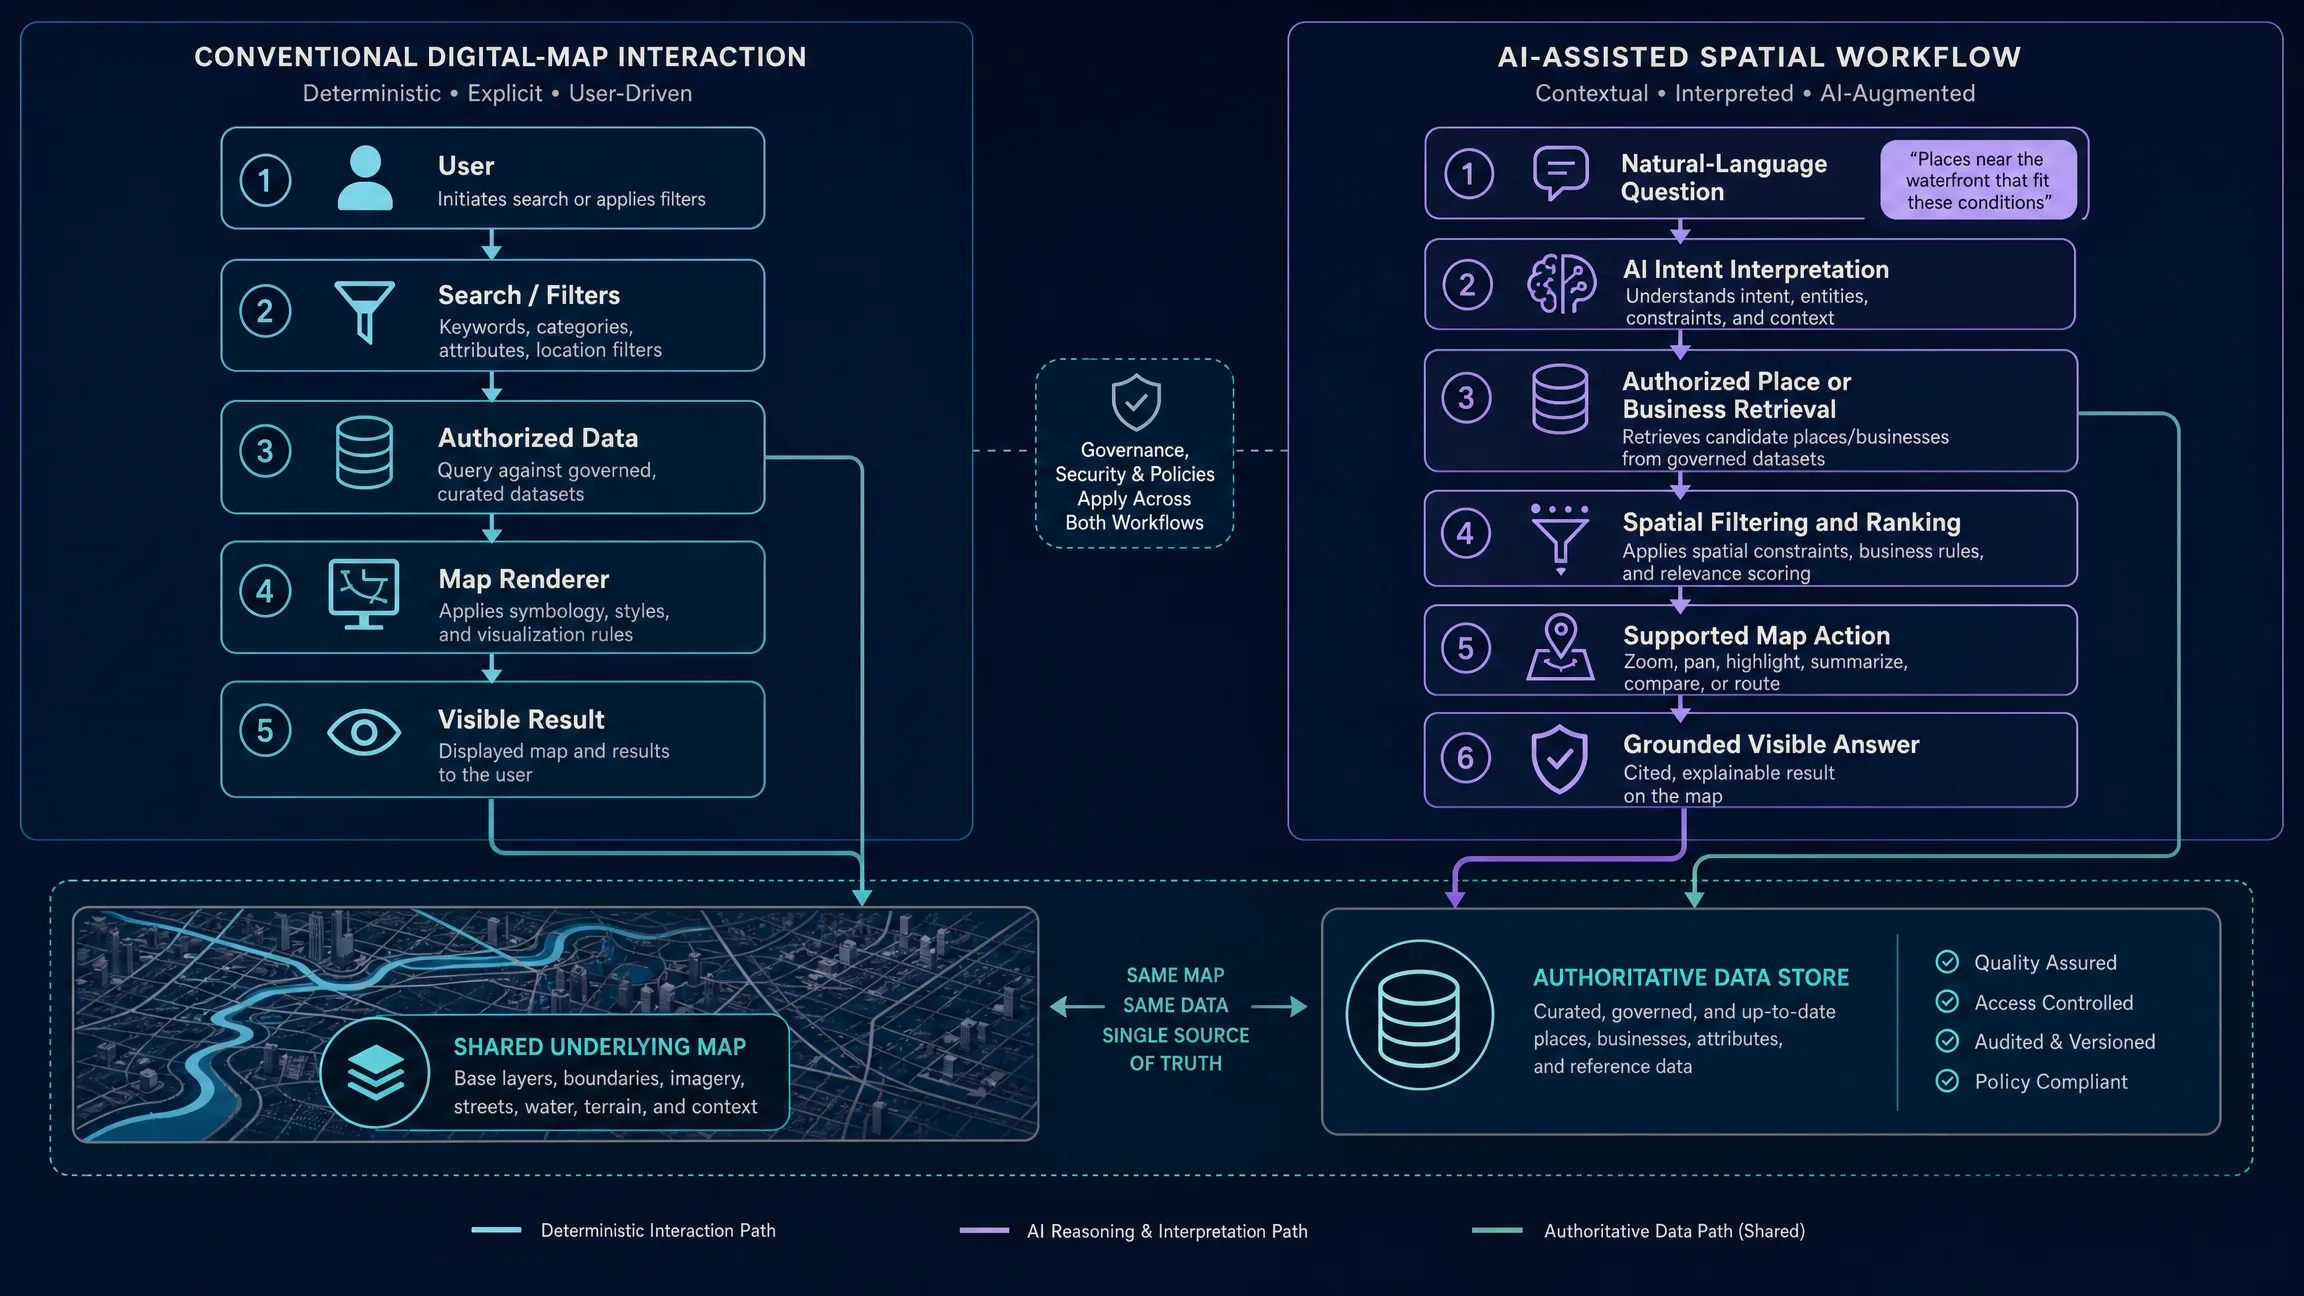
AI mapping adds an intelligence layer to a digital map rather than replacing the stack. A conventional map can display places, filter layers, search records, show routes, and respond to clicks. An AI-enhanced map can additionally interpret higher-level requests such as family-friendly waterfront places for an early dinner, or which locations sit near transit and underserved competitors. A strong architecture routes a user question through intent interpretation, authorized place or business retrieval, spatial filtering or ranking, a supported map action, and a grounded visible answer. The language model should not become the source of truth for coordinates, inventory, legal boundaries, opening hours, route geometry, private records, or permissions. AI is most useful when requests contain several changing or contextual conditions; a deterministic filter is usually better for a single boolean such as open now. The related AI Mapping guide covers the broader category taxonomy.
How Does Kaleidr Fit Into the Stack?
Kaleidr does not need to replace the underlying map renderer. Current developer documentation describes one JavaScript SDK that can provide AI map chat, published map viewers, designed basemaps, and an embedded map editor, including chat attached to an existing Mapbox, Google Maps, or MapLibre implementation. Kaleidr Spatial AI supports natural-language place discovery and map-aware recommendations. Kaleidr Studio provides prompt-first visual creation—Prompt, Process, Refine, Deploy—with custom tiles, branded basemaps, layers, datasets, 3D visualization, and publishing as a page or embed. A visual builder fits editorial maps, destination guides, events, and teams that want to publish without maintaining a mapping codebase. Custom code fits property search, fleet tracking, logistics, live inventory, marketplace search, SaaS mapping, and private operational data where the host owns identity, permissions, filters, selected objects, business rules, and persistence while the renderer owns camera, visual layers, and map events. Keep authoritative data, permissions, and business workflow in the appropriate host systems; use map and AI layers to make that information spatially understandable and actionable. Separate publishable browser keys from backend server keys, and never move a server credential into client-side code for convenience.
Which Mistakes Should Teams Avoid?
| Mistake | What happens | Better approach |
|---|---|---|
| Treating the map as one image | Data and behavior couple tightly | Separate data, style, and renderer |
| Mixing coordinate systems | Features appear in the wrong place | Validate CRS, units, and order |
| Sending every record to the browser | Performance and privacy suffer | Filter and authorize before delivery |
| Using AI as the source of place facts | Answers become ungrounded | Retrieve authoritative place data |
| Loading every layer immediately | Startup becomes slow | Load by task and visibility |
| Using a map without a text alternative | Accessibility suffers | Provide synchronized lists and controls |
| Choosing 3D by default | Complexity can reduce clarity | Use 3D only when height matters |
| Measuring map opens only | Usage is mistaken for value | Measure completed geographic tasks |
| Exposing server credentials | Backend access becomes public | Separate browser and backend keys |
Interactive digital maps should also provide textual equivalents for important locations, keyboard-operable controls, visible focus, non-color status indicators, sufficient target sizes, and understandable empty states. Monitor bundle size, style-load time, first visible map, first visible application data, tile latency, interaction responsiveness, and data-refresh cost. Prefer lazy-loading below the fold, requesting only needed data, clustering dense points, tiling large datasets, and separating map boot from secondary UI.
Final Verdict
Digital mapping turns geographic data into a computer-readable map that can be rendered, updated, searched, styled, analyzed, and interacted with. The modern stack separates data, coordinates, sources and layers, style, tiles and services, renderer, and application. AI can sit above that stack to interpret natural-language intent and coordinate more complex spatial interactions, but it does not replace geographic data, the renderer, business rules, or authorization. For customer-facing maps, decide how much of the stack to own: a visual platform such as Kaleidr Studio can handle creation, styling, and publishing, while developer teams can keep an existing renderer and attach Kaleidr AI or embedded components where conversational spatial intelligence adds value.
Explore Digital Mapping With Kaleidr
Describe the map you want, refine spatial structure and visual design, and publish an interactive experience. Start building in Kaleidr Studio when you want a prompt-first path, then use Spatial AI for natural-language discovery and the developer documentation when you need SDK embeds or chat on an existing renderer.
FAQs
What is digital mapping?
Digital mapping is the use of computer-readable geographic data to create maps that can be stored, rendered, updated, searched, analyzed, or interacted with electronically.
How does a digital map work?
A digital map combines geographic data with coordinates, map sources, layers, visual styles, and a rendering engine. Web maps often retrieve geographic content through APIs or tiled map services as the user pans and zooms.
What is the difference between vector and raster mapping?
Vector data represents discrete features with points, lines, and polygons. Raster data represents space as cells or pixels. Many digital maps combine both.
What are digital map tiles?
Map tiles divide geographic information into smaller chunks so an application can request only what is needed for the current map view. Tiles can contain pre-rendered raster images or encoded vector features.
Is digital mapping the same as GIS?
No. Digital mapping focuses on creating and displaying maps in digital systems. GIS is a broader system for managing, analyzing, editing, and displaying geographically referenced information.
Is digital mapping the same as AI mapping?
No. AI mapping adds machine-learning or language-model capabilities to a digital mapping workflow. A digital map does not need AI to function.
Can I create a digital map without coding?
Yes. Visual map builders can provide map creation, styling, layer management, and publishing without requiring the user to implement a renderer. Kaleidr Studio currently uses a prompt-first visual workflow for creating and publishing interactive maps.
Where does spatial AI fit in a digital map?
Spatial AI sits above or alongside the core map stack. It can interpret user intent, select relevant geographic context, rank places, and coordinate supported map actions while authoritative spatial and business data remain the source of factual information.
Does Kaleidr replace Mapbox, Google Maps, or MapLibre?
Not necessarily. Kaleidr’s current developer documentation describes attaching AI chat to Mapbox, Google Maps, or MapLibre maps that an application already runs, as well as offering its own viewer, editor, and designed-basemap components.
References
- Esri. Layers — ArcGIS Pro documentation. Accessed 14 August 2026. https://pro.arcgis.com/en/pro-app/latest/help/mapping/layer-properties/layers.htm
- Kaleidr. AI Maps You Can Talk To — Spatial AI. Accessed 14 August 2026. https://kaleidr.com/ai
- Kaleidr. Create Custom Maps with AI Map Maker. Accessed 14 August 2026. https://kaleidr.com/studio
- Kaleidr. Build with Kaleidr. Developer documentation. Accessed 14 August 2026. https://docs.kaleidr.com/
- MapLibre. MapLibre GL JS Introduction. Accessed 14 August 2026. https://maplibre.org/maplibre-gl-js/docs/
- MapLibre. MapLibre Style Specification. Accessed 14 August 2026. https://maplibre.org/maplibre-style-spec/
- Open Geospatial Consortium. OGC API — Maps — Part 1: Core. Accessed 14 August 2026. https://docs.ogc.org/is/20-058/20-058.html
- Open Geospatial Consortium. OGC API — Tiles. Accessed 14 August 2026. https://ogcapi.ogc.org/tiles/overview.html
- Open Geospatial Consortium. Web Map Tile Service. Accessed 14 August 2026. https://www.ogc.org/standards/wmts/
- U.S. Geological Survey. Feature representation. Accessed 14 August 2026. https://www.usgs.gov/centers/cegis/science/feature-representation
- U.S. Geological Survey. What is a geographic information system (GIS)?. Accessed 14 August 2026. https://www.usgs.gov/faqs/what-a-geographic-information-system-gis
@misc{usgs_feature_representation,
  title  = {Feature representation},
  author = {{U.S. Geological Survey}},
  note   = {Accessed 14 August 2026},
  url    = {https://www.usgs.gov/centers/cegis/science/feature-representation}
}

@misc{usgs_gis_faq,
  title  = {What is a geographic information system (GIS)?},
  author = {{U.S. Geological Survey}},
  note   = {Accessed 14 August 2026},
  url    = {https://www.usgs.gov/faqs/what-a-geographic-information-system-gis}
}

@misc{esri_layers,
  title  = {Layers -- ArcGIS Pro documentation},
  author = {{Esri}},
  note   = {Accessed 14 August 2026},
  url    = {https://pro.arcgis.com/en/pro-app/latest/help/mapping/layer-properties/layers.htm}
}

@misc{maplibre_gl_js_2026,
  title  = {MapLibre GL JS Introduction},
  author = {{MapLibre}},
  note   = {Accessed 14 August 2026},
  url    = {https://maplibre.org/maplibre-gl-js/docs/}
}

@misc{maplibre_style_spec,
  title  = {MapLibre Style Specification},
  author = {{MapLibre}},
  note   = {Accessed 14 August 2026},
  url    = {https://maplibre.org/maplibre-style-spec/}
}

@misc{ogc_wmts,
  title  = {Web Map Tile Service},
  author = {{Open Geospatial Consortium}},
  note   = {Accessed 14 August 2026},
  url    = {https://www.ogc.org/standards/wmts/}
}

@misc{ogc_api_tiles,
  title  = {OGC API -- Tiles},
  author = {{Open Geospatial Consortium}},
  note   = {Accessed 14 August 2026},
  url    = {https://ogcapi.ogc.org/tiles/overview.html}
}

@misc{ogc_api_maps,
  title  = {OGC API -- Maps -- Part 1: Core},
  author = {{Open Geospatial Consortium}},
  year   = {2024},
  url    = {https://docs.ogc.org/is/20-058/20-058.html}
}

@misc{kaleidr_studio_2026_08_14,
  title  = {Create Custom Maps with AI Map Maker},
  author = {{Kaleidr}},
  note   = {Accessed 14 August 2026},
  url    = {https://kaleidr.com/studio}
}

@misc{kaleidr_ai_2026_08_14,
  title  = {AI Maps You Can Talk To -- Spatial AI},
  author = {{Kaleidr}},
  note   = {Accessed 14 August 2026},
  url    = {https://kaleidr.com/ai}
}

@misc{kaleidr_docs_2026_08_14,
  title  = {Build with Kaleidr},
  author = {{Kaleidr}},
  note   = {Developer documentation; accessed 14 August 2026},
  url    = {https://docs.kaleidr.com/}
}