
An AI generated map can mean a static illustration, an analytical surface, or an editable interactive experience. An interactive AI map is the third type: real geographic objects, layers, controls, and user actions rather than pixels alone. Choose a static image for visual communication. Choose an interactive AI map when users must search, filter, inspect places, ask questions, update data, or embed the map in a product.
The sections below separate those formats, show when each is appropriate, and explain how Kaleidr Studio turns a prompt into a reviewable interactive map. Related reading includes the AI interactive map builder guide and the AI mapping types overview.
Comparison essentials
- Static AI-generated map: A flattened visual—pixels or exported artwork—optimized for viewing, print, and shareable imagery.
- Interactive AI map: A living geographic experience with queryable places, layers, map state, and supported user actions.
- Spatial-data bridge: Detect, vectorize, enrich, index, and serve—turning appearance into structured geography.
- Human review gate: Validate places, labels, sources, design, and interactions before publication.
- Hybrid publishing: Keep the interactive map as the source of truth; export a reviewed static visual when print or social reach is required.
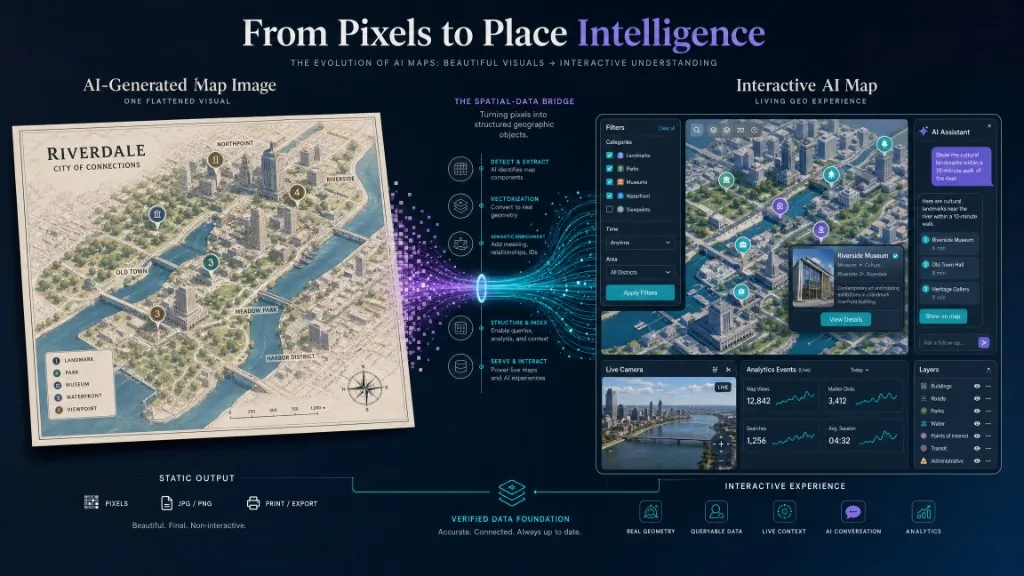
AI Generated Map vs Interactive AI Map at a Glance
The decisive difference is whether the deliverable is an image or a working geographic system. A static AI-generated map can still be useful for illustration, concept art, posters, or report figures; an interactive map is not automatically “intelligent” either. The interactive product becomes an AI map when language models or related systems contribute to creation, ranking, recommendation, map actions, or conversation while the application resolves facts against approved sources.
| Decision area | Static AI-generated map | Interactive AI map |
|---|---|---|
| Primary output | Raster or vector image | Live geographic application or embedded map |
| Geographic structure | May look geographic without queryable features | Coordinates, geometries, layers, properties, and map state |
| User interaction | View, download, crop, or annotate | Pan, zoom, search, filter, select, ask, edit, save, or share |
| Data connection | Usually none after generation | Can load, update, and query approved data sources |
| Place accuracy | Depends on the prompt, model, and reference material | Depends on resolved geographic data and source systems |
| Editing model | Regenerate or edit pixels and vectors | Edit data, styles, layers, labels, interactions, and camera state |
| Accessibility | Useful alternative text and surrounding explanation | Accessible controls, text equivalents, keyboard behavior, and result lists |
| Publishing | Image file, document, presentation, or social post | Share link, viewer, website, application, SDK, or API workflow |
| Analytics | Page or image-level engagement | Map events, searches, selections, saves, shares, and conversions |
| Best fit | Illustration, concept art, poster, report figure, or editorial graphic | Discovery, planning, property search, tourism, retail, operations, and spatial products |
What Does an AI Generated Map Actually Mean?
Search results for “AI generated map” mix several product classes, and treating them as one category produces mismatched expectations. The first class is an AI-generated map image: an image model creates a visual map, fantasy world, illustrated route, or map-like composition from a prompt. The result may be compelling, yet it need not contain valid coordinates, real place identities, searchable features, route geometry, editable layers, map controls, a geographic projection, or a connection to current information. That format fits concept art, game worlds, presentation graphics, editorial illustration, and mood boards.
The second class is an AI-generated analytical map. A model or spatial-analysis workflow produces a map from real data—land-cover classification, flood or wildfire risk surfaces, object detection from satellite imagery, accessibility models, cluster maps, suitability analysis, or change detection. The deliverable may be static or interactive; the defining feature is that AI contributes to analysis rather than only appearance.
The third class is an AI-assisted interactive map. An AI map builder turns a written concept into a functional draft with locations, categories, layers, styles, and interactions, and a person then reviews, corrects, refines, and publishes. Kaleidr Studio documents this as Prompt → Process → Refine → Deploy: AI organizes spatial structure, then human editors refine design, content, style, and interaction before deployment. A fourth pattern is conversational or map-aware AI, in which an existing map gains a language interface that resolves places, adds markers, frames the camera, or answers geographic questions. Kaleidr’s developer platform documents chat attachment to supported Mapbox, Google Maps, and MapLibre maps alongside published viewers and designed basemaps; see the Kaleidr developer documentation.
How Do Pixels Differ From Geographic Objects?
A static image stores appearance. An interactive map stores or retrieves geographic objects and rules for rendering them. A map image can show a visible pin labeled “Central Park,” but that pin is part of a merged pixel grid: the application cannot reliably ask the pixel for a stable place ID, geometry, properties, source, style layer, click state, or analytics event. By contrast, a structured geographic feature is a first-class, addressable place object with an identifier, geometry (for example a GeoJSON point), properties, provenance, and downstream hooks into rendering, detail panels, filters, and AI actions.
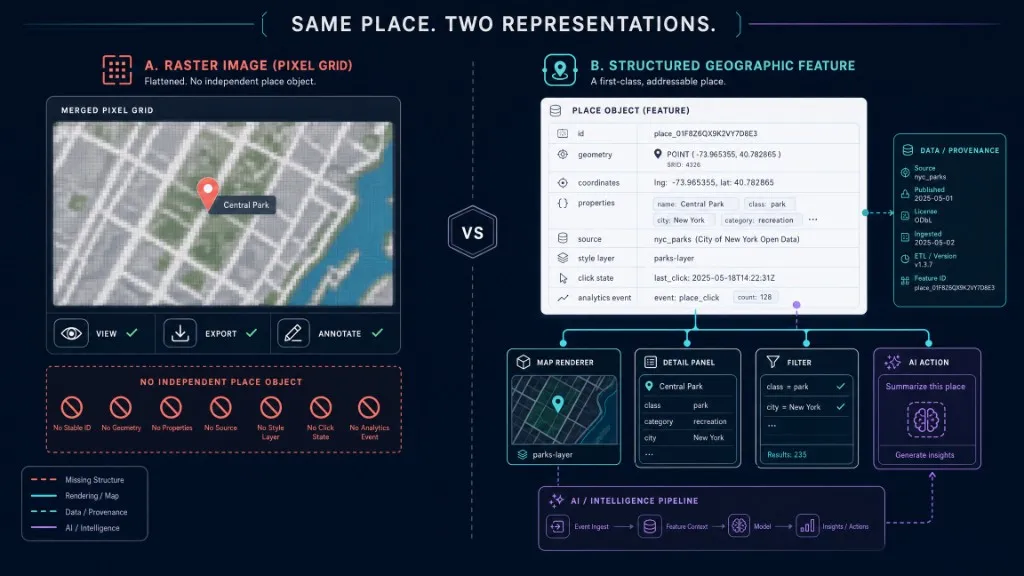
Structured objects make selection, property filters, style changes, bounds calculation, detail pages, record updates, interaction measurement, and map actions applied to the correct feature possible. RFC 7946 defines GeoJSON as a JSON-based format for geographic features, their properties, and spatial extents; the illustrative feature below follows that general model and is not a live Kaleidr API response.
{
  "type": "Feature",
  "id": "place_4821",
  "geometry": {
    "type": "Point",
    "coordinates": [-77.0365, 38.8977]
  },
  "properties": {
    "name": "Example Place",
    "category": "museum",
    "source": "approved_place_source"
  }
}
The practical rule is simple: a static map is a visual artifact, while an interactive map is a stateful system. Turning pixels into place intelligence requires detection and extraction, vectorization into real geometry, semantic enrichment with meaning and identifiers, structure and indexing for queries, and serving that model to live maps and AI experiences. Without that spatial-data bridge, “map-looking” imagery remains communication, not geography you can operate on.
How Does an Interactive AI Map Work?
An interactive AI map usually combines six layers of responsibility. The host experience owns the interface, account, permissions, workflow, saved state, and conversion actions. The AI creation or interaction layer interprets prompts, resolves intent, ranks candidates, proposes supported actions, and explains results. Geographic data supplies places, coordinates, lines, polygons, attributes, and update timestamps. The map renderer owns camera, styles, labels, markers, layers, terrain, and interaction behavior. Business systems hold authoritative inventory, listings, assets, eligibility, pricing, or private records. Analytics captures searches, selections, no-result states, edits, saves, shares, and downstream outcomes.
| Layer | Responsibility |
|---|---|
| Host experience | Interface, account, permissions, workflow, saved state, conversions |
| AI creation or interaction | Prompt interpretation, intent, ranking, supported actions, explanations |
| Geographic data | Places, coordinates, lines, polygons, attributes, update timestamps |
| Map renderer | Camera, styles, labels, markers, layers, terrain, interaction behavior |
| Business systems | Inventory, listings, assets, eligibility, pricing, or private records |
| Analytics | Searches, selections, edits, saves, shares, and outcomes |
The AI layer should not become the source of truth for factual place or business data. Language models can interpret intent and coordinate supported actions, but the application should resolve and validate important facts against approved sources. A typical loop runs as follows: the user describes a map or asks a location question; the AI layer identifies entities, constraints, and requested actions; the application retrieves or validates geographic and business data; the system creates structured features, styles, or map actions; the renderer applies the result; and the interface exposes the result, sources, and controls for further refinement. That architecture keeps the output inspectable—users can see which places were added, which filter was applied, which area was selected, and which source supports the answer.
Consider the prompt “Create a map of independent bookstores, coffee shops, and public spaces for a literary weekend in Boston.” A static image generator might produce a polished illustrated map with neighborhood labels and stylized icons—excellent as a poster or social image, yet unable to verify current businesses, open a bookstore detail, filter coffee shops, change a route, add a place, or measure which location users select. An interactive builder can treat the same prompt as a specification: geographic focus on Boston; categories for bookstores, coffee shops, and public spaces; filters, selection, questions, save, and share; editorial typography; and a published web map or embed. Human review still verifies places, corrects categories, edits descriptions, refines the basemap, tests interactions, and publishes. A follow-up question such as “Which two bookstores are near a public garden and a coffee shop?” requires queryable place objects and geographic relationships that a static image cannot reliably answer without reconstructing the missing data elsewhere.
When Is a Static AI Generated Map the Better Choice?
Use a static map image when the primary requirement is communication rather than interaction. Strong fits include fictional or fantasy maps, game or film concepts, editorial illustration, presentation covers, posters, simplified report figures, visual route summaries, early design mood boards, and decorative backgrounds. Static output is also the correct final format when the audience will print the map, view it once, or consume it inside a medium that does not support interaction.
Production standards still apply. Teams should review facts when real places are depicted, confirm usage rights for reference imagery and data, provide appropriate attribution, keep labels readable, export at usable quality, and supply useful alternative text. WCAG 2.2 requires accessible treatment of non-text content; a map image that communicates meaningful information needs an equivalent text description or surrounding explanation appropriate to the context.
When Is an Interactive AI Map the Better Choice?
Choose an interactive AI map when the map must help a user complete a spatial task. Strong fits include destination and tourism discovery, travel maps with visited and planned places, property search, store locators, local business discovery, event and campus navigation, asset and field operations, market or service-area exploration, map-based storytelling, customer-facing spatial products, and internal operational dashboards. Interactive maps are especially useful when underlying information changes: a map connected to current listings, inventory, assets, events, or operational records can update without regenerating an entire visual artifact.
Renderer models reinforce the distinction. MapLibre GL JS, for example, is designed to render interactive maps from vector tiles in the browser, with appearance controlled by a style document. The map is assembled from sources, layers, styles, and live state rather than delivered as one fixed picture. Editable structure matters more than the attractiveness of the first draft: creators should be able to add and reorder layers, correct places or geometries, change categories and labels, control colors and typography, set the initial camera, define clicks and filters, connect approved datasets, publish and update, embed in a product, measure interaction, and preserve a human-reviewed version. Kaleidr Studio emphasizes that transition from generated spatial structure to custom design, content, style, and interaction, including custom basemaps, 3D terrain and buildings, live data layers, reusable style presets, and multi-surface deployment.
Does AI Remove the Need for Geographic Review?
AI can accelerate the first draft, but map-making responsibilities remain. Reviewers should confirm that each real place exists, that coordinates match the intended place, that duplicate names were resolved correctly, that categories are accurate, that addresses and opening information are current where shown, that routes use an approved routing service, that labels do not overlap or mislead, that the initial camera shows the intended area, that the layout works at mobile sizes, that private data is authorized for the current user, and that attribution and licensing requirements are met. The generation workflow should produce a draft that remains editable. A system that hides AI-generated decisions inside an uninspectable output is difficult to correct and govern.
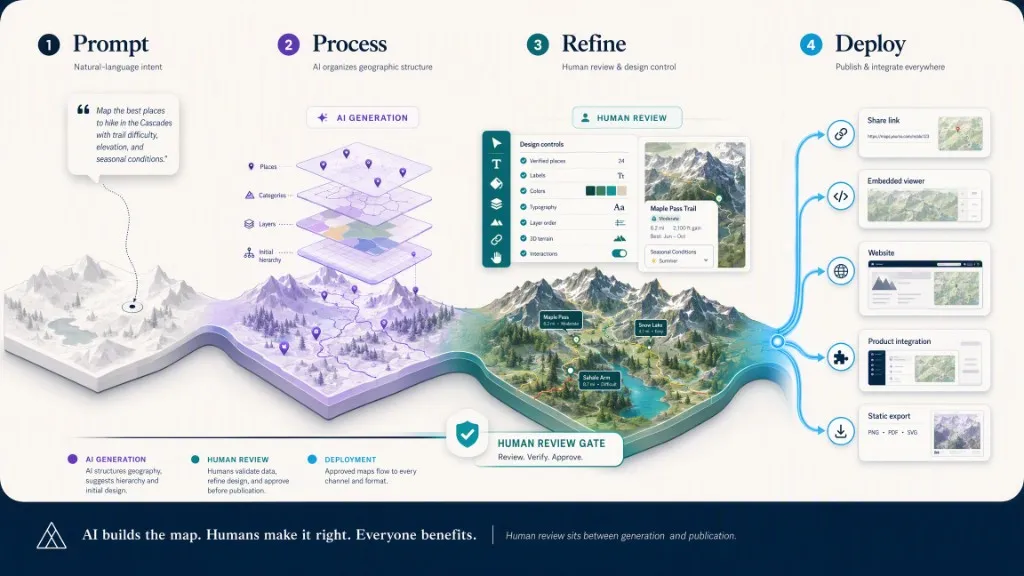
Human review sits between generation and publication. AI structures geography and suggests hierarchy and initial design; humans validate data, refine design, and approve before anything ships; approved maps then flow to share links, embedded viewers, websites, product integrations, and static exports such as PNG, PDF, or SVG when those channels are required.
How Does Kaleidr Turn a Prompt Into an Interactive Map?
Kaleidr separates map creation, interaction, publication, and developer integration. Kaleidr Studio is the creation surface: prompt the concept, let AI generate and organize spatial structure, refine design and interaction, then deploy across digital platforms. That path differs from asking an image model to render a map-like picture because the intended output remains a map that can be styled, published, and used. A published Studio map can be embedded by share ID through the Viewer product; current documentation describes a share-link-gated embed that owns its own map. Publisher-defined allowed-domain restrictions still apply—see Viewer embed and Embed a published map.
<kaleidr-map
  product="viewer"
  share-id="abcd1234"
  style="height: 520px">
</kaleidr-map>
Kaleidr Chat attaches conversational spatial interaction to a supported live map: the existing renderer remains responsible for the map, while Kaleidr adds place answers, live markers, and chat-driven navigation when an application already runs Mapbox, Google Maps, or MapLibre. The developer platform also documents an embedded editor and designed basemaps. The image-versus-interactive decision should be made before choosing the exact product surface; for architecture depth, see adding AI chat to Mapbox, Google Maps, or MapLibre.
How Do SEO and Accessibility Differ by Format?
An interactive map can be valuable to users yet weak for discovery when the page contains only a canvas or iframe. Google’s guidance for generative AI features continues to emphasize foundational SEO, crawlable content, clear technical structure, useful original material, and relevant images or video, and warns against producing many near-duplicate pages merely to target keyword variations (AI optimization guide). For either format, include a precise page title and H1, a direct description of the map, geographic coverage, categories or datasets, instructions for interactive controls, a text list or summary of important locations when appropriate, data source and update date, accessibility alternatives, creator or reviewer information, relevant internal links, original screenshots or diagrams, and structured data only when it accurately matches visible page content. Do not assume the map canvas alone communicates purpose to search engines or assistive technology.
Accessibility requirements also diverge. A static map image needs concise alternative text for its purpose, a longer description when the map communicates complex information, readable labels and adequate contrast, a text table or list when exact values matter, and an accessible document format when distributed as a report. An interactive map needs an equivalent searchable or navigable result list, keyboard-accessible controls, visible focus states, accessible names for buttons and regions, a non-drag alternative for drawing actions, text equivalents for marker color and symbols, status announcements for loading and result changes, a mobile layout that does not hide essential controls, and a way to reset or undo AI-driven actions. Essential information must never depend only on pointer movement or visual position.
Governance obligations diverge as well. Static images raise questions about training and reference-image rights, logos and landmark depictions, false geographic precision, attribution, and sensitive locations. Interactive maps add source-data licenses, tile and map-provider terms, place-data storage and display restrictions, user permissions, tenant isolation, location-history retention, private-record access, API-key security, analytics consent and retention, allowed publishing domains, and update or deletion workflows. The map should disclose where important data comes from; AI-generated descriptions should not obscure the source of factual place or business attributes.
How Should Teams Choose the Right Format?
Start from the audience task, not from the novelty of generation. Choose a static AI-generated map when the final deliverable is an image, the geography may be fictional or illustrative, no live search or filters are required, the audience will print or view passively, the map is one visual inside a larger document, and the project does not need structured geographic data. Choose an interactive AI map when users need to pan, zoom, select, filter, or search; when the map must use verified real-world places; when information changes over time; when the experience needs AI questions or recommendations; when users need to save or share map state; when the map must be embedded in a product; when the team needs event analytics; or when geographic objects must remain editable.
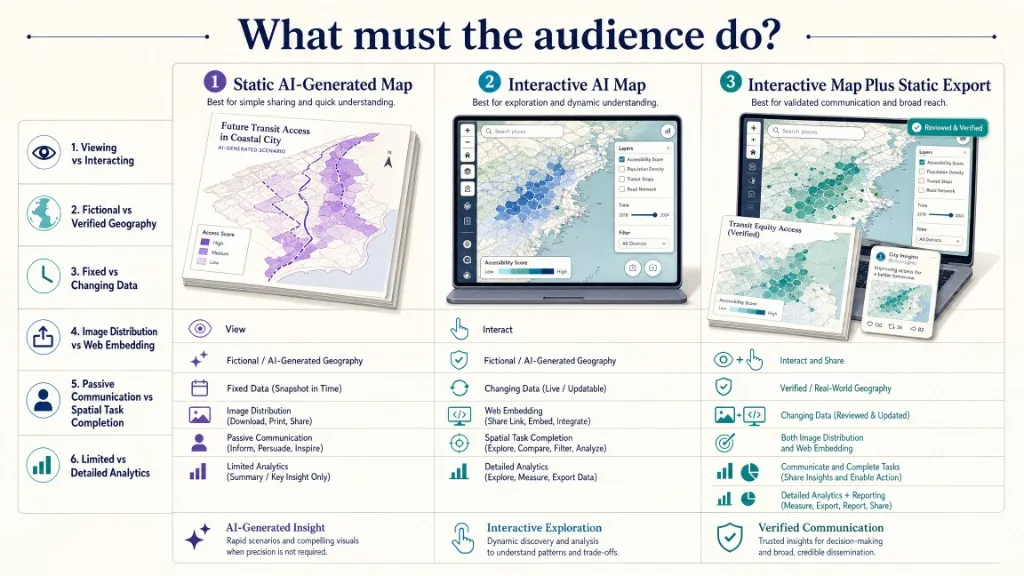
Use both when the interactive map is the source experience and a static export is needed for reports, social posts, print, or presentations. In a combined workflow, generate the interactive map first, review the data and design, then produce a static export from the approved map state so the image and live experience do not communicate different information. Before selecting a product, confirm whether the output is a file or a functional application; whether real places resolve into stable geographic objects; whether creators can inspect and correct structure; whether sources and update dates are available; whether layers and styles are editable; whether mobile interaction and accessible alternatives exist; whether publish, update, and embed paths are documented; whether approved business data can be connected securely with separated browser and server credentials; whether users can undo AI-driven changes; whether important actions are measurable; and whether a reviewed static export can be produced when required.
| Mistake | What happens | Recommended correction |
|---|---|---|
| Calling every map-like image interactive | Users expect controls and live data that do not exist | State whether the output is an image, analysis result, or application |
| Treating visual realism as accuracy | Polished images can contain fictional streets or places | Validate real geography against approved sources |
| Publishing the first AI draft | Incorrect places and labels reach users | Require human review and an editable workflow |
| Hiding filters inside chat history | Users cannot reproduce the result | Convert AI interpretation into visible map state |
| Rendering only a map canvas | Search engines and assistive technology receive little context | Add crawlable text, result lists, and metadata |
| Using a static image for changing data | The visual becomes stale immediately | Connect an interactive map to an update workflow |
| Using an interactive map for a simple poster | Complexity rises without user value | Export a reviewed static visual instead |
| Treating model output as the data source | Fabricated or stale facts appear authoritative | Resolve places through approved systems |
| Ignoring rights and attribution | The project may violate provider or data terms | Document every source and publishing requirement |
| Tracking only page views | Teams cannot tell whether the map helps users | Measure searches, selections, saves, shares, and conversions |
Final Verdict
An AI generated map is a broad category, not one file type or workflow. The output may be a static illustration, an analytical map, or an editable interactive experience. Choose a static image when the map’s job is visual communication. Choose an interactive AI map when users need to explore geography, work with structured places, apply filters, ask questions, update information, or complete a product task. For Kaleidr, Studio is designed to turn a prompt into spatial structure that can be reviewed, refined, branded, published, and connected to other interactive products—so the result remains a working map, not merely an image that looks like one.
Create an Interactive Map From a Prompt
Describe the map concept, let Kaleidr organize the initial spatial structure, and refine content, design, layers, and interactions before publishing. Start Building in Kaleidr Studio for the prompt-first path. Review Viewer, Chat, Editor, Tiles, SDK, authentication, and deployment docs in the developer documentation when the finished map needs to live inside a website or product.
FAQs
What is an AI-generated map?
An AI-generated map is any map output whose appearance, structure, analysis, or interaction was created with AI assistance. The output may be a static image, an analytical result, or an editable interactive map.
Is an AI-generated map geographically accurate?
Not automatically. A static image model may create convincing but fictional geography. Real-world maps should resolve places, coordinates, routes, and attributes through approved geographic and business data sources.
What is an interactive AI map?
An interactive AI map is a live geographic experience in which users can manipulate the map and AI contributes to creation, search, conversation, ranking, recommendation, or supported map actions.
Is an AI map image the same as an AI map builder?
No. An image generator creates pixels or vector artwork. An AI map builder creates or assists with geographic structure, styles, content, and interactions that remain editable and publishable.
Can I turn an AI-generated image into an interactive map?
Not directly in a reliable way. Places, geometries, identifiers, and attributes must be reconstructed or sourced as structured geographic data. The image can serve as a design reference, but it is not a substitute for the data model.
References
- Google. Article structured data. Google Search Central. Accessed 31 July 2026. https://developers.google.com/search/docs/appearance/structured-data/article
- Google. Optimizing your website for generative AI features on Google Search. Google Search Central. Accessed 31 July 2026. https://developers.google.com/search/docs/fundamentals/ai-optimization-guide
- Internet Engineering Task Force. RFC 7946: The GeoJSON Format. Accessed 31 July 2026. https://datatracker.ietf.org/doc/rfc7946/
- Kaleidr. Create Custom Maps with AI Map Maker. kaleidr.com. Accessed 31 July 2026. https://kaleidr.com/studio
- Kaleidr. Embed a published map. Kaleidr Developer Docs. Accessed 31 July 2026. https://docs.kaleidr.com/guides/embed-a-map
- Kaleidr. Introduction. Kaleidr Developer Docs. Accessed 31 July 2026. https://docs.kaleidr.com
- Kaleidr. Viewer — embed a published map. Kaleidr Developer Docs. Accessed 31 July 2026. https://docs.kaleidr.com/sdk/viewer-embed
- MapLibre. Introduction — MapLibre GL JS. Accessed 31 July 2026. https://maplibre.org/maplibre-gl-js/docs/
- World Wide Web Consortium. Web Content Accessibility Guidelines (WCAG) 2.2. Accessed 31 July 2026. https://www.w3.org/TR/WCAG22/
@misc{kaleidr_studio,
  title  = {Create Custom Maps with AI Map Maker},
  author = {{Kaleidr}},
  note   = {Accessed 31 July 2026},
  url    = {https://kaleidr.com/studio}
}

@misc{kaleidr_viewer_embed,
  title  = {Viewer -- embed a published map},
  author = {{Kaleidr}},
  note   = {Kaleidr Developer Docs; accessed 31 July 2026},
  url    = {https://docs.kaleidr.com/sdk/viewer-embed}
}

@misc{ietf_geojson,
  title  = {RFC 7946: The GeoJSON Format},
  author = {{Internet Engineering Task Force}},
  note   = {Accessed 31 July 2026},
  url    = {https://datatracker.ietf.org/doc/rfc7946/}
}

@misc{maplibre_introduction,
  title  = {Introduction -- MapLibre GL JS},
  author = {{MapLibre}},
  note   = {Accessed 31 July 2026},
  url    = {https://maplibre.org/maplibre-gl-js/docs/}
}

@misc{wcag22,
  title  = {Web Content Accessibility Guidelines 2.2},
  author = {{World Wide Web Consortium}},
  note   = {Accessed 31 July 2026},
  url    = {https://www.w3.org/TR/WCAG22/}
}

@misc{google_ai_search_guide,
  title  = {Optimizing your website for generative AI features on Google Search},
  author = {{Google}},
  note   = {Google Search Central; accessed 31 July 2026},
  url    = {https://developers.google.com/search/docs/fundamentals/ai-optimization-guide}
}