
Un panel de análisis espacial conecta el comportamiento dentro del producto con el contexto geográfico para que los equipos comprueben si los mapas ayudan a completar tareas que dependen de la ubicación. Debe mostrar búsquedas satisfactorias, lugares seleccionados, zonas sin resultados, tiempo hasta una respuesta útil y si la actividad en el mapa terminó en un guardado, una ruta, un cliente potencial, una compra o una nueva visita; no solo cuántas personas abrieron el mapa. Diseña la medición en torno a las decisiones del usuario y a dimensiones de lugar o región gobernadas; considera los desplazamientos, el zoom y las cargas brutas como señales auxiliares, no como pruebas de valor.
Las siguientes secciones explican cómo elegir métricas, estructurar la jerarquía de KPI, gestionar eventos y privacidad, elaborar informes que no induzcan a error y evitar fallos comunes. Para conocer el contexto de producto sobre la interacción con mapas y lugares, consulta Kaleidr Analytics. Confirma el acceso de tu plan en Precios y planes, ya que el acceso público a Analytics todavía se habilita por etapas.
Aspectos esenciales de un panel de análisis espacial
- Decide primero: define la decisión de negocio antes de elegir gráficos.
- Métrica principal y métricas de control: combina un resultado útil con comprobaciones de calidad y fiabilidad.
- Conserva los denominadores: para comparar, las tasas son mejores que los recuentos regionales brutos.
- Gobierna los identificadores: los ID estables de mapa, lugar, región y resultado conectan las capas.
- Privacidad desde el diseño: agrega la geografía, oculta celdas con poco volumen y reduce la precisión.
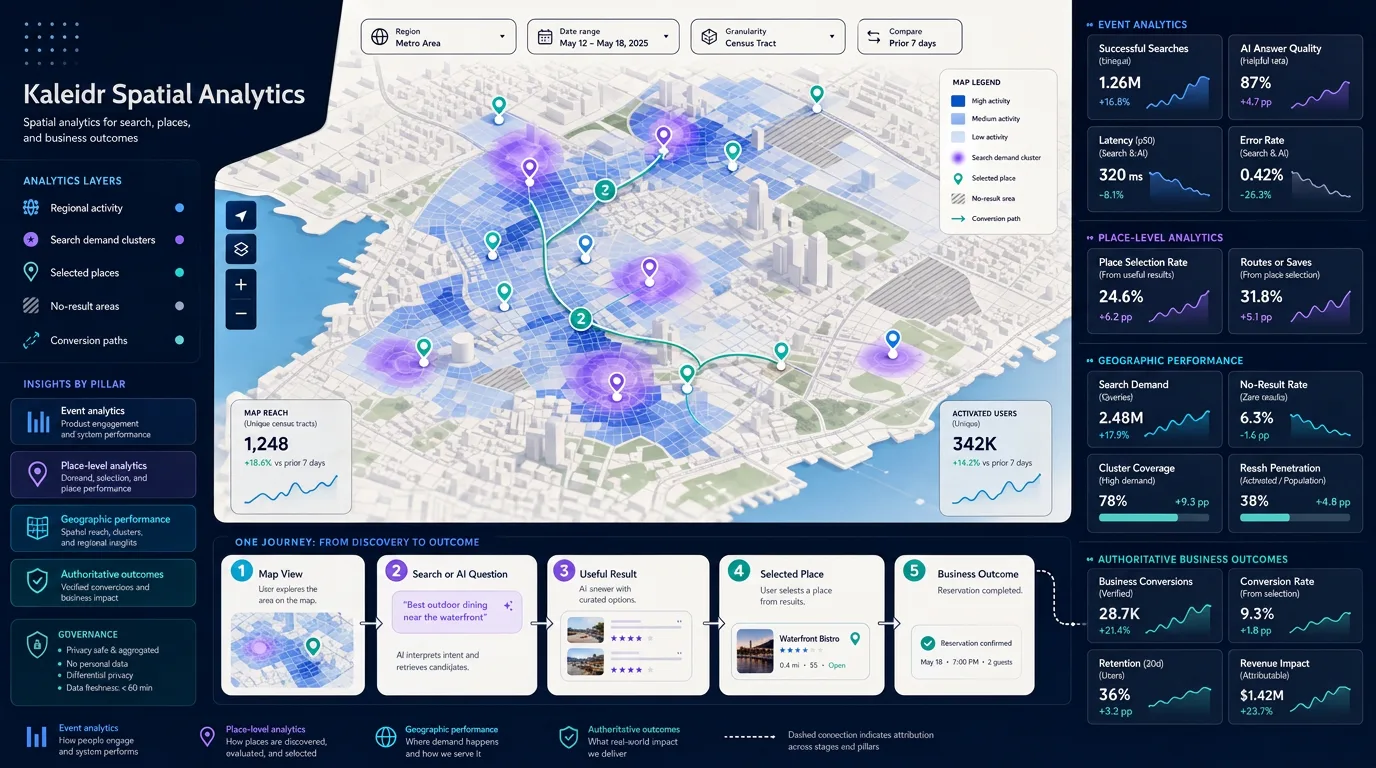
¿Qué es un panel de análisis espacial?
Un panel de análisis espacial es una interfaz de informes que analiza la actividad del producto en relación con mapas, lugares, regiones y flujos de trabajo geográficos. Centros de análisis web tradicionales en páginas, sesiones, canales y conversiones. Una capa espacial agrega preguntas como qué mapas y lugares atraen la atención, dónde fracasan las búsquedas o las preguntas de inteligencia artificial, qué ubicaciones conducen a rutas o consultas y dónde se descompone la cobertura o la calidad de los datos.
Kaleidr Analytics se describe en su página de producto público como un panel de control para la participación en el mapa y el lugar, organizando sesiones, vistas, interacciones, actividad de la audiencia, atención al lugar y tendencias espaciales alrededor de los mapas en lugar de solo las URL. Esa página también establece que el acceso se está implementando en los equipos en etapas, mientras que los precios enumeran Analytics en Free, Pro y Enterprise. Confirme la disponibilidad de su cuenta antes dependiendo de un flujo de trabajo de producción específico.
¿En qué se diferencian el análisis de mapas y el análisis espacial?
Las etiquetas se superponen, pero enfatizan diferentes niveles. La analítica web pregunta cómo llegaron los usuarios al sitio. El análisis de productos pregunta qué acciones completaron. análisis de mapas pregunta cómo utilizaron la superficie del mapa. El análisis espacial pregunta cómo varían esas acciones según el lugar, la región, la distancia, la cobertura o el contexto geográfico. La inteligencia de negocios pregunta qué resultados operativos o financieros siguieron. Un panel de control fuerte conecta las capas sin colapsarlas en un solo número de vanidad.
| Capa | Pregunta principal | Ejemplo |
|---|---|---|
| Analítica web | ¿Cómo llegaron los usuarios y navegaron por el sitio? | Sesiones, canal, landing page |
| Análisis de productos | ¿Qué acciones de producto completaron los usuarios? | Buscar, guardar, compartir, publicar |
| Análisis de mapas | ¿Cómo interactúan los usuarios con el mapa? | Ver, seleccionar marcador, ruta, pregunta de IA |
| Analítica espacial | ¿Cómo varían las acciones en el lugar o la región? | �sanidades sin resultados, conversión regional |
| Inteligencia de negocios | ¿Qué resultado siguió? | Reserva, lead, ingresos, retención |
Un mapa puede producir muchas interacciones y pocos resultados útiles. Un lugar puede atraer vistas sin rutas. Una región puede mostrar una alta tasa de conversión porque solo un puñado de usuarios calificados ingresaron. Preserva los denominadores y el contexto detrás de cada figura principal.
¿Cómo deben elegir los equipos las métricas y los controles?
Comience con la decisión que debe mejorar el panel de control, ya sea que el chat de IA encuentre lugares más rápidos, qué destinos guardan los usuarios, qué tiendas se convierten mal después de la búsqueda o dónde la cobertura de inventario crea resultados vacíos. Escriba una oración de decisión que nombre el resultado, el mapa o el comportamiento geográfico, y la porción de mapas, lugares, regiones o flujos de trabajo en revisión. Esa oración selecciona eventos, dimensiones, filtros y visualizaciones.
Elija una métrica de estrella del norte que represente una contribución útil del mapa, no una mera exposición. Combínalo con métricas de control para que el equipo no pueda mejorar un número degradando la calidad en otro lugar.
| Tipo de producto | Posible métrica de estrella norte | Útiles métricas de control |
|---|---|---|
| Descubsamiento local | Lugar relevante seleccionado | Tasa de no resultados, latencia, cobertura |
| Localizador de tiendas | Tienda elegible seleccionada o instrucciones iniciadas | Horas de oleada, errores de elegibilidad |
| Mapa turístico | Lugar guardado, acción de itinerario, o compartir | Búsquedas vacías, frescura de contenido |
| Búsqueda de propiedades | Listado guardado o investigación iniciada | Stale inventario, geografía sin resultado |
| Asistente de mapa de IA | Respuesta completada seguida de una acción de mapa | Activas no soportadas, errores de flujo |
| Creación de mapas | Mapa publicado o incrustado | Borrados abandonados, fracasos de los editores |
¿Qué jerarquía de KPI debe seguir un panel de análisis espacial?
Organice las métricas como un viaje desde la exposición hasta el valor duradero, con métricas de control de calidad debajo. El alcance pregunta si los usuarios tuvieron la oportunidad significativa de usar el mapa: vistas calificadas después de un umbral de visibilidad, usuarios únicos o sesiones con una vista de mapa, y alcance por página, campaña, dispositivo o geografía segura para la privacidad. La activación pregunta si tomaron una primera acción intencional, como búsqueda, pregunta de IA, filtro o interacción con marcadores. La resolución pregunta si recibieron un resultado utilizable: búsquedas exitosas, respuestas completadas, citas fundamentadas cuando sea necesario y acciones de mapa que se aplicaron sin fallar. El compromiso pregunta si seleccionaron, guardaron, enrutaron, compartieron o progresaron de otra manera. Los resultados empresariales preguntan si un sistema autorizado registra una reserva, lidera, compra, recogida, publicación o finalización del flujo de trabajo. La retención pregunta si los usuarios activados devuelven y reutilean el mapa dentro de una ventana definida.
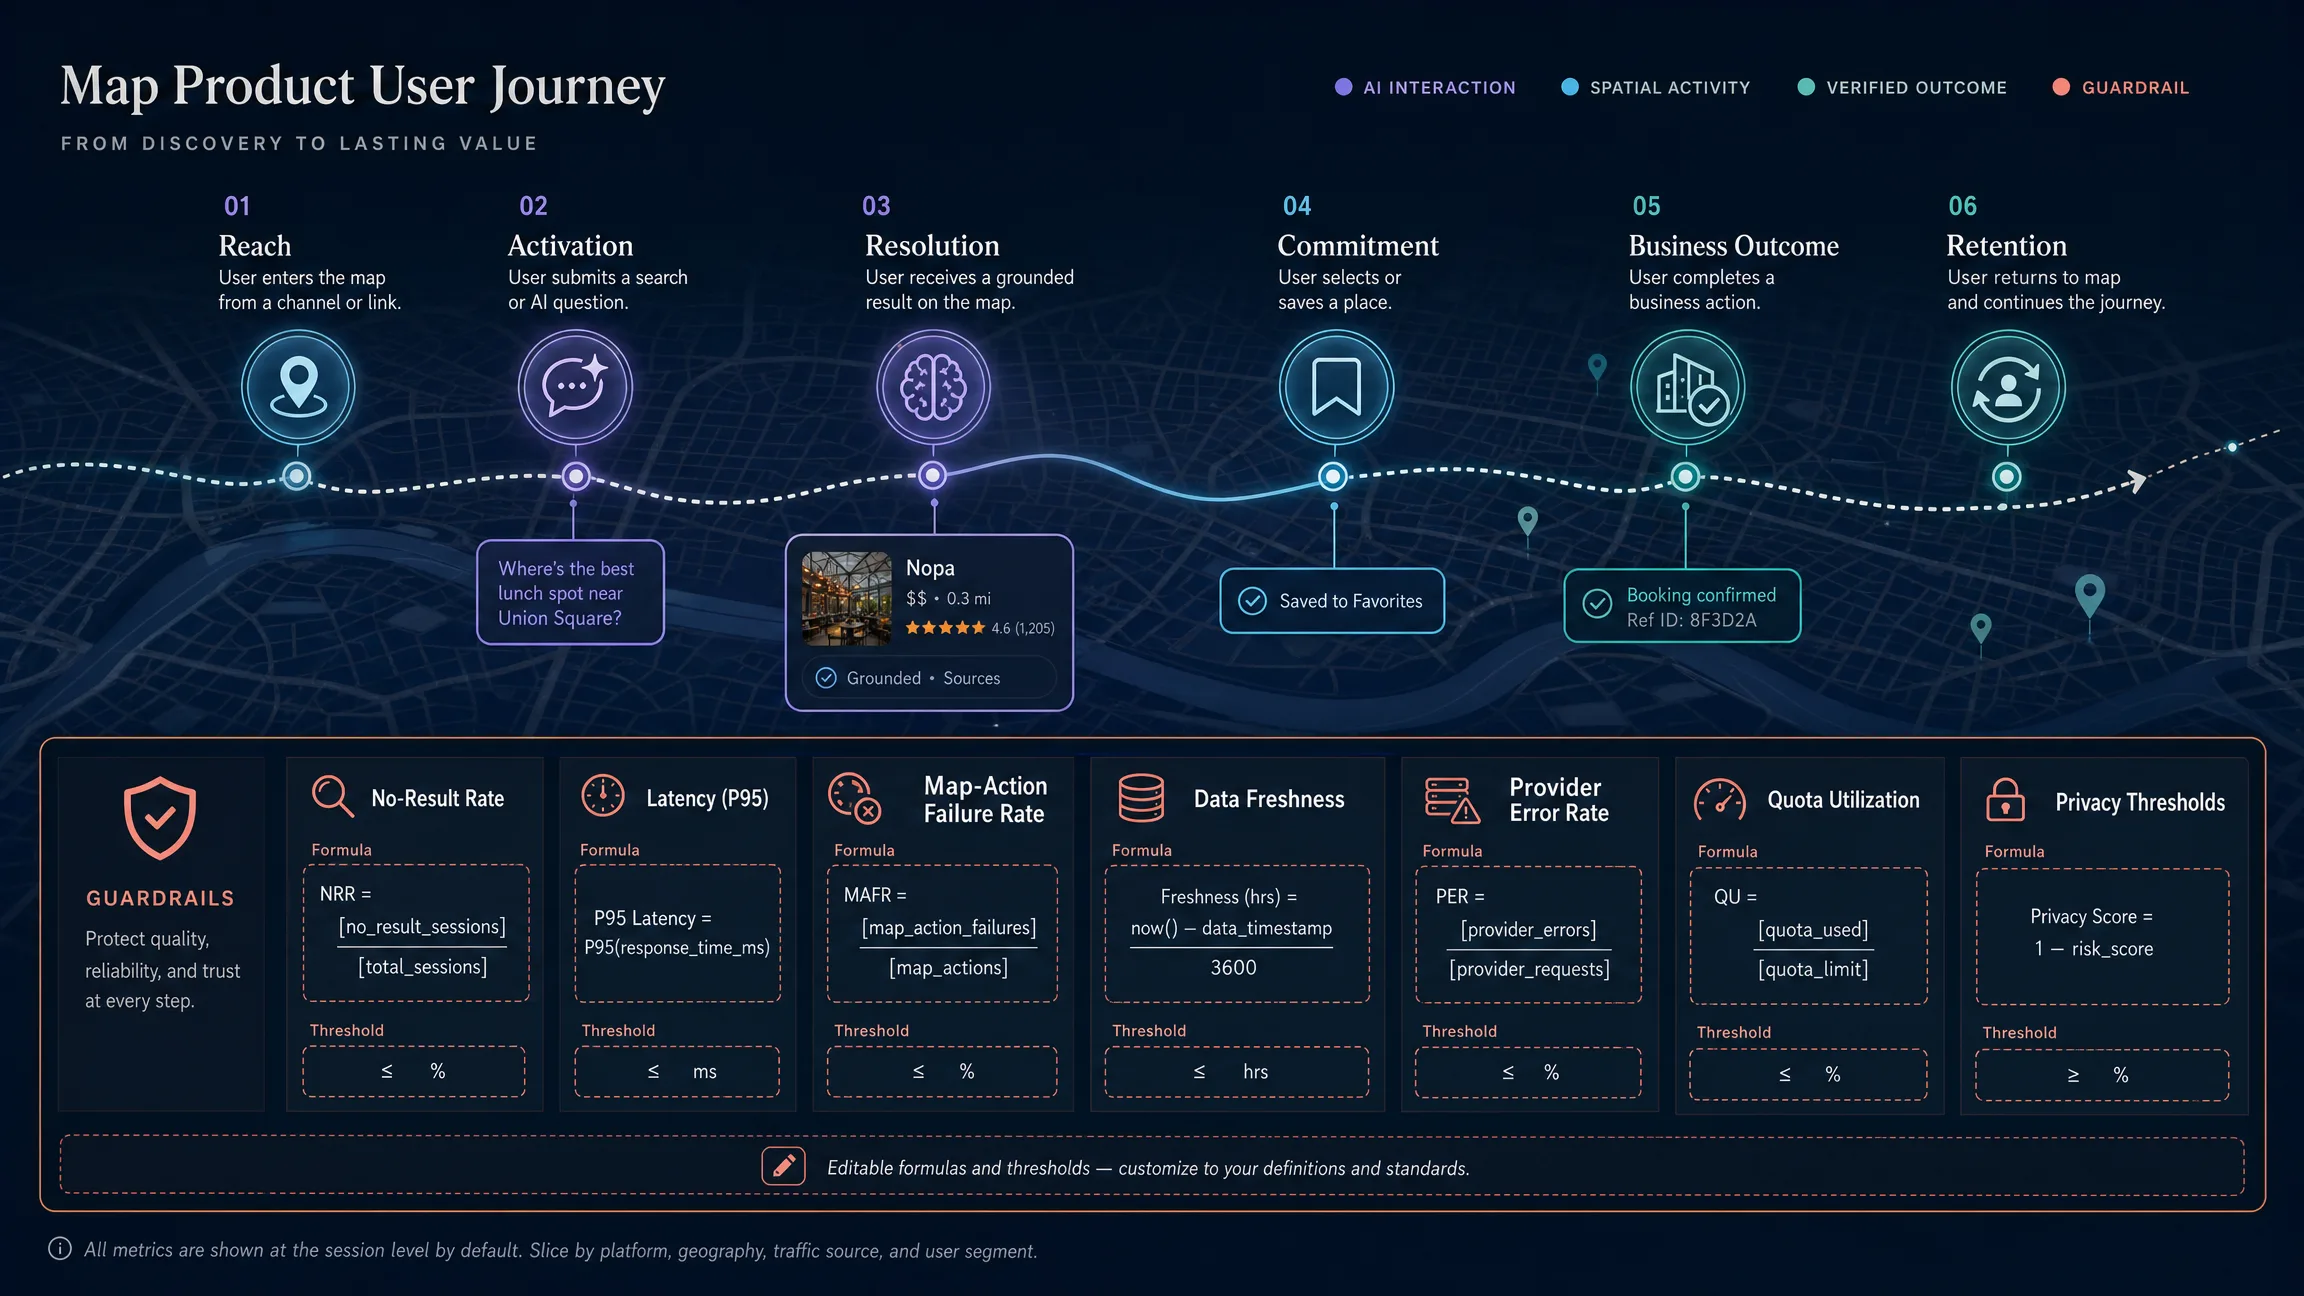
Las métricas de control mantienen el embudo honesto: tasa de no resultado, latencia al primer resultado útil, falla de la acción del mapa, frescura de los datos, errores del proveedor, presión de las cuotas y umbrales de privacidad. Prefiera las tasas con denominadores documentados: activación entre espectadores calificados, resultados útiles entre búsquedas o respuestas completadas, selecciones entre conjuntos de resultados y conversiones entre usuarios activados. Las fórmulas editoriales como “resultados útiles / búsquedas completadas” pertenecen a un diccionario métrico versionado; son el diseño de medición, no los eventos automáticos de Kaleidr Analytics.
¿Cómo se relacionan los eventos, la geografía y la privacidad?
Defina una taxonomía de eventos versionada antes de los gráficos de envío. Los nombres de eventos recomendados en este artículo son editoriales: úselos como un contrato de anfitrión a menos que un documento de producto indique lo contrario. Capture la vista de mapa, la búsqueda o la pregunta de IA enviada, el resultado devuelto o completado, el lugar seleccionado, el guardar o la ruta, el traspaso del resultado comercial y las clases de fracaso que separan los errores sin resultado. Adjunta parámetros estables como ID de mapa, ID de lugar, ID de región, modo de producto, categoría de intención, latencia y estado de resultado. Unirse a reservas autorizadas, clientes potenciales, inventario o finalización de flujo de trabajo de los sistemas empresariales en lugar de inventar resultados en el navegador.
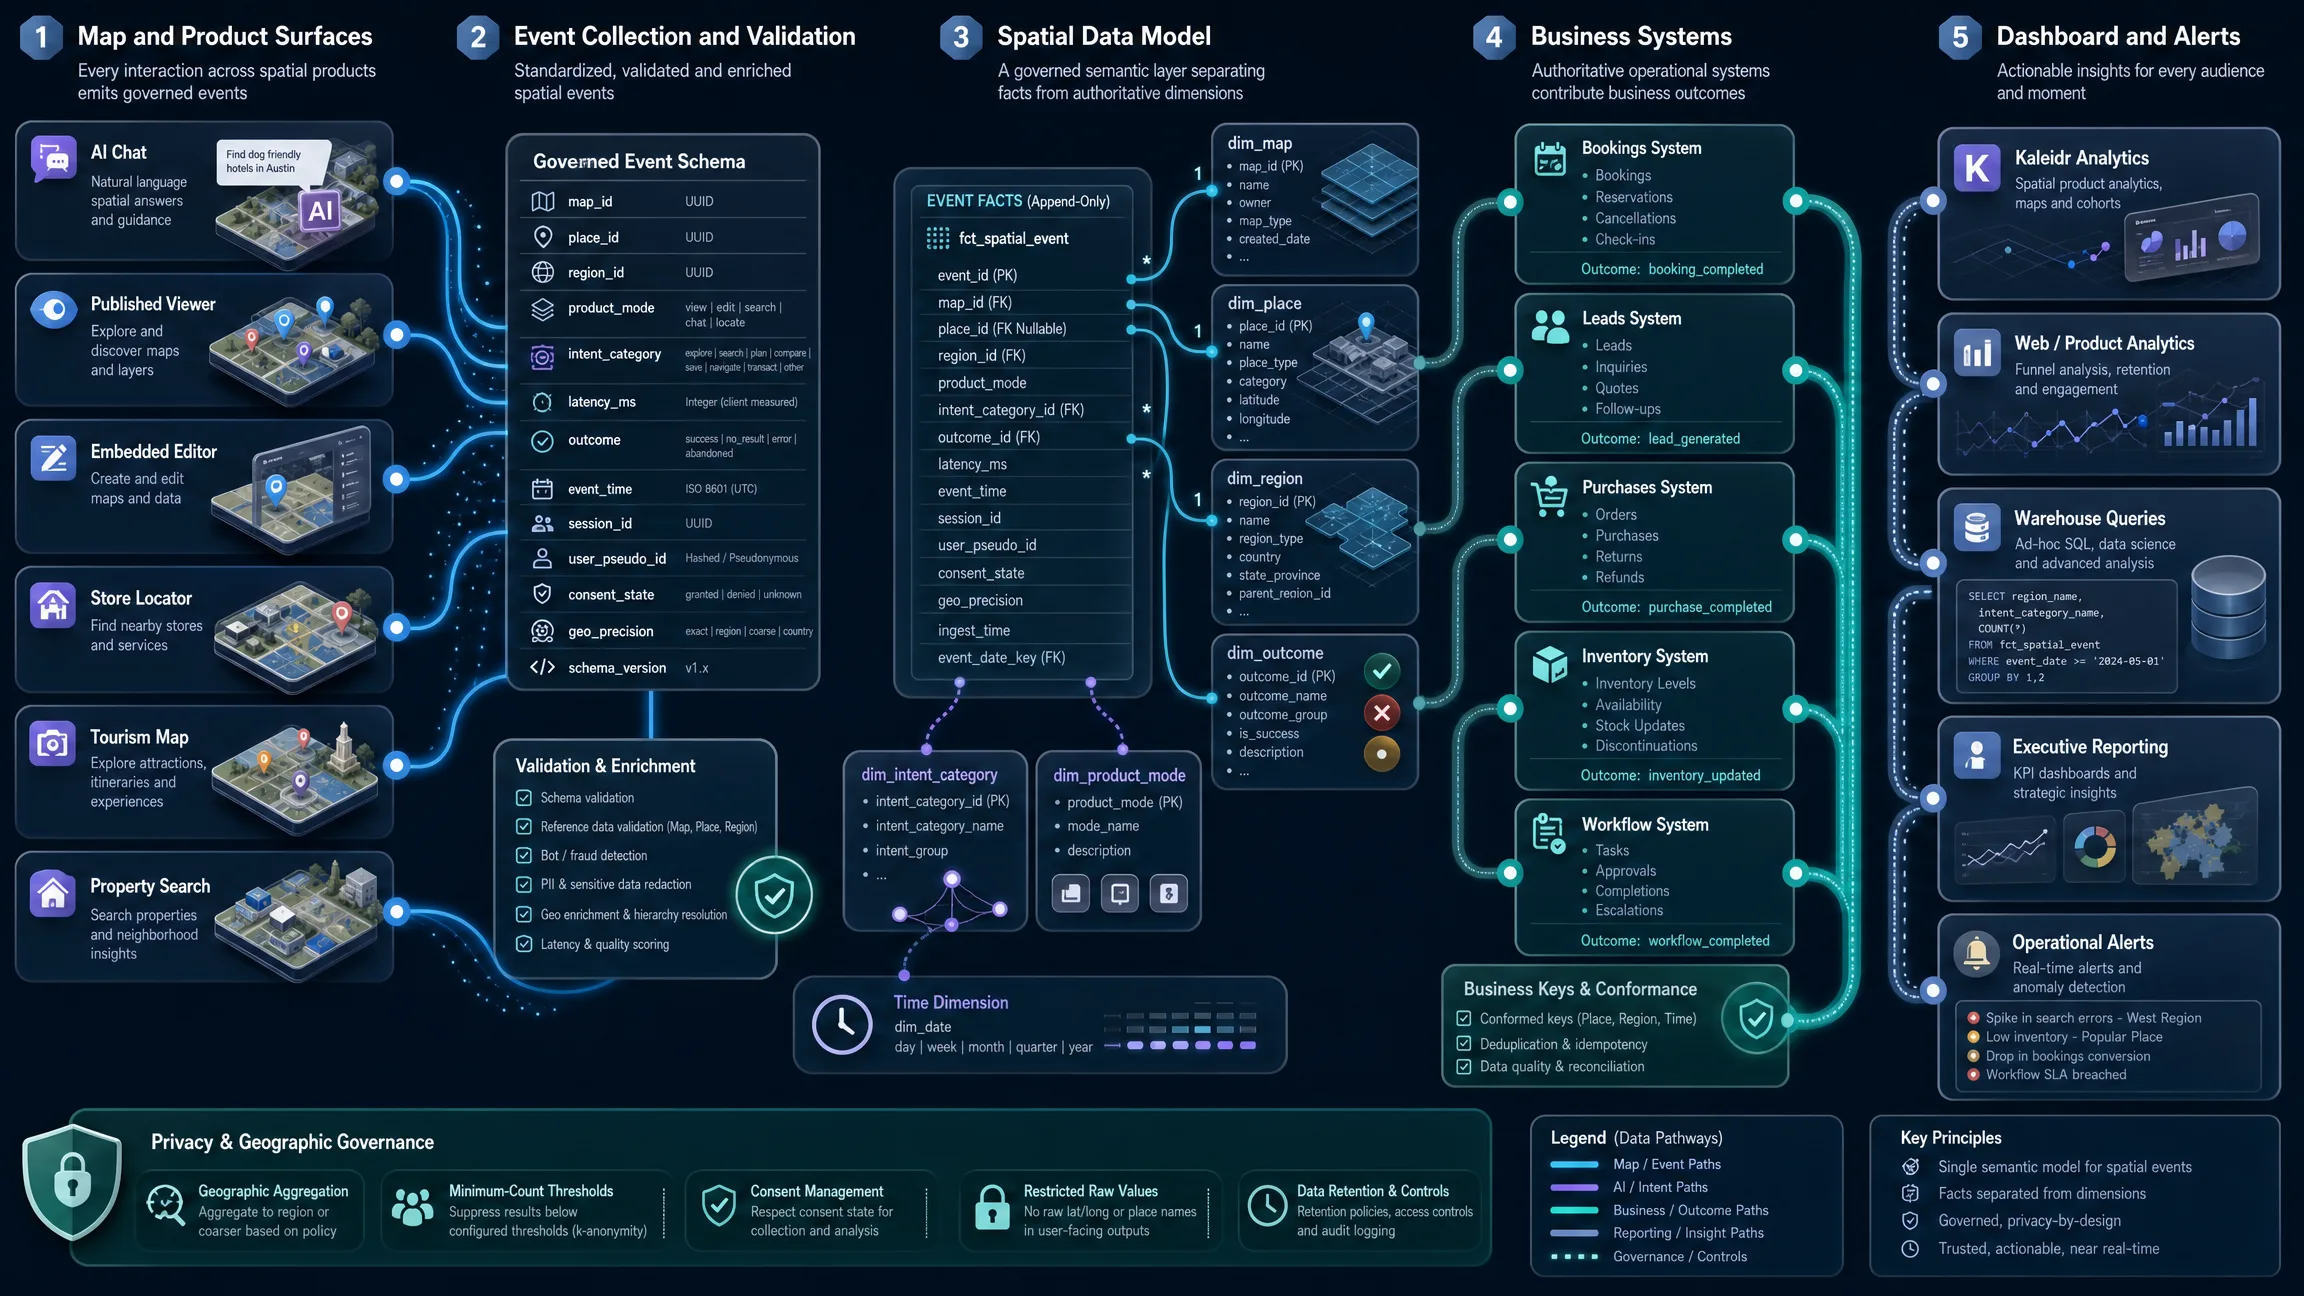
Las dimensiones geográficas necesitan una jerarquía controlada: país, región, ciudad, zona de servicio o polígono personalizado, además de reglas para el verdadero cero, cobertura faltante, celdas de bajo volumen suprimidas y datos obsoletos. Recopile la precisión mínima de ubicación requerida, restrinja el acceso, defina la retención, agregue informes y evite enviar coordenadas personales o direcciones en términos generales de análisis de forma predeterminada. Los materiales de análisis público de Kaleidr enfatizan el mapeo y el compromiso de lugar; una pila de hosts aún puede usar eventos personalizados de GA4, embudos, la API de datos y la exportación de BigQuery donde se ajustan esas superficies, recordando las diferencias de documentos de Google entre informes, Exploraciones, la API de datos y BigQuery.
¿Cómo deben informar los equipos sin crear mapas engañosos?
Los recuentos regionales crudos a menudo reflejan la población o el tráfico, no la calidad del producto. Prefira las tasas normalizadas con denominadores visibles, tamaño de la muestra y frescura. Distinga el cero verdadero de las células faltantes o suprimidas en la leyenda. Combine cada mapa geográfico con una tabla clasificada accesible que enumere la región, los usuarios o eventos elegibles, la tasa, el tamaño de la muestra y la edad de los datos para que los usuarios de teclado y tecnología de asistencia no sean solo de mapa. Etiqueta la fuente de información de la verdad para cada KPI cuando los números de la interfaz de usuario de GA4 y los extractos de almacén no están de acuerdo, lo que la propia guía de comparación de Google anticipa.
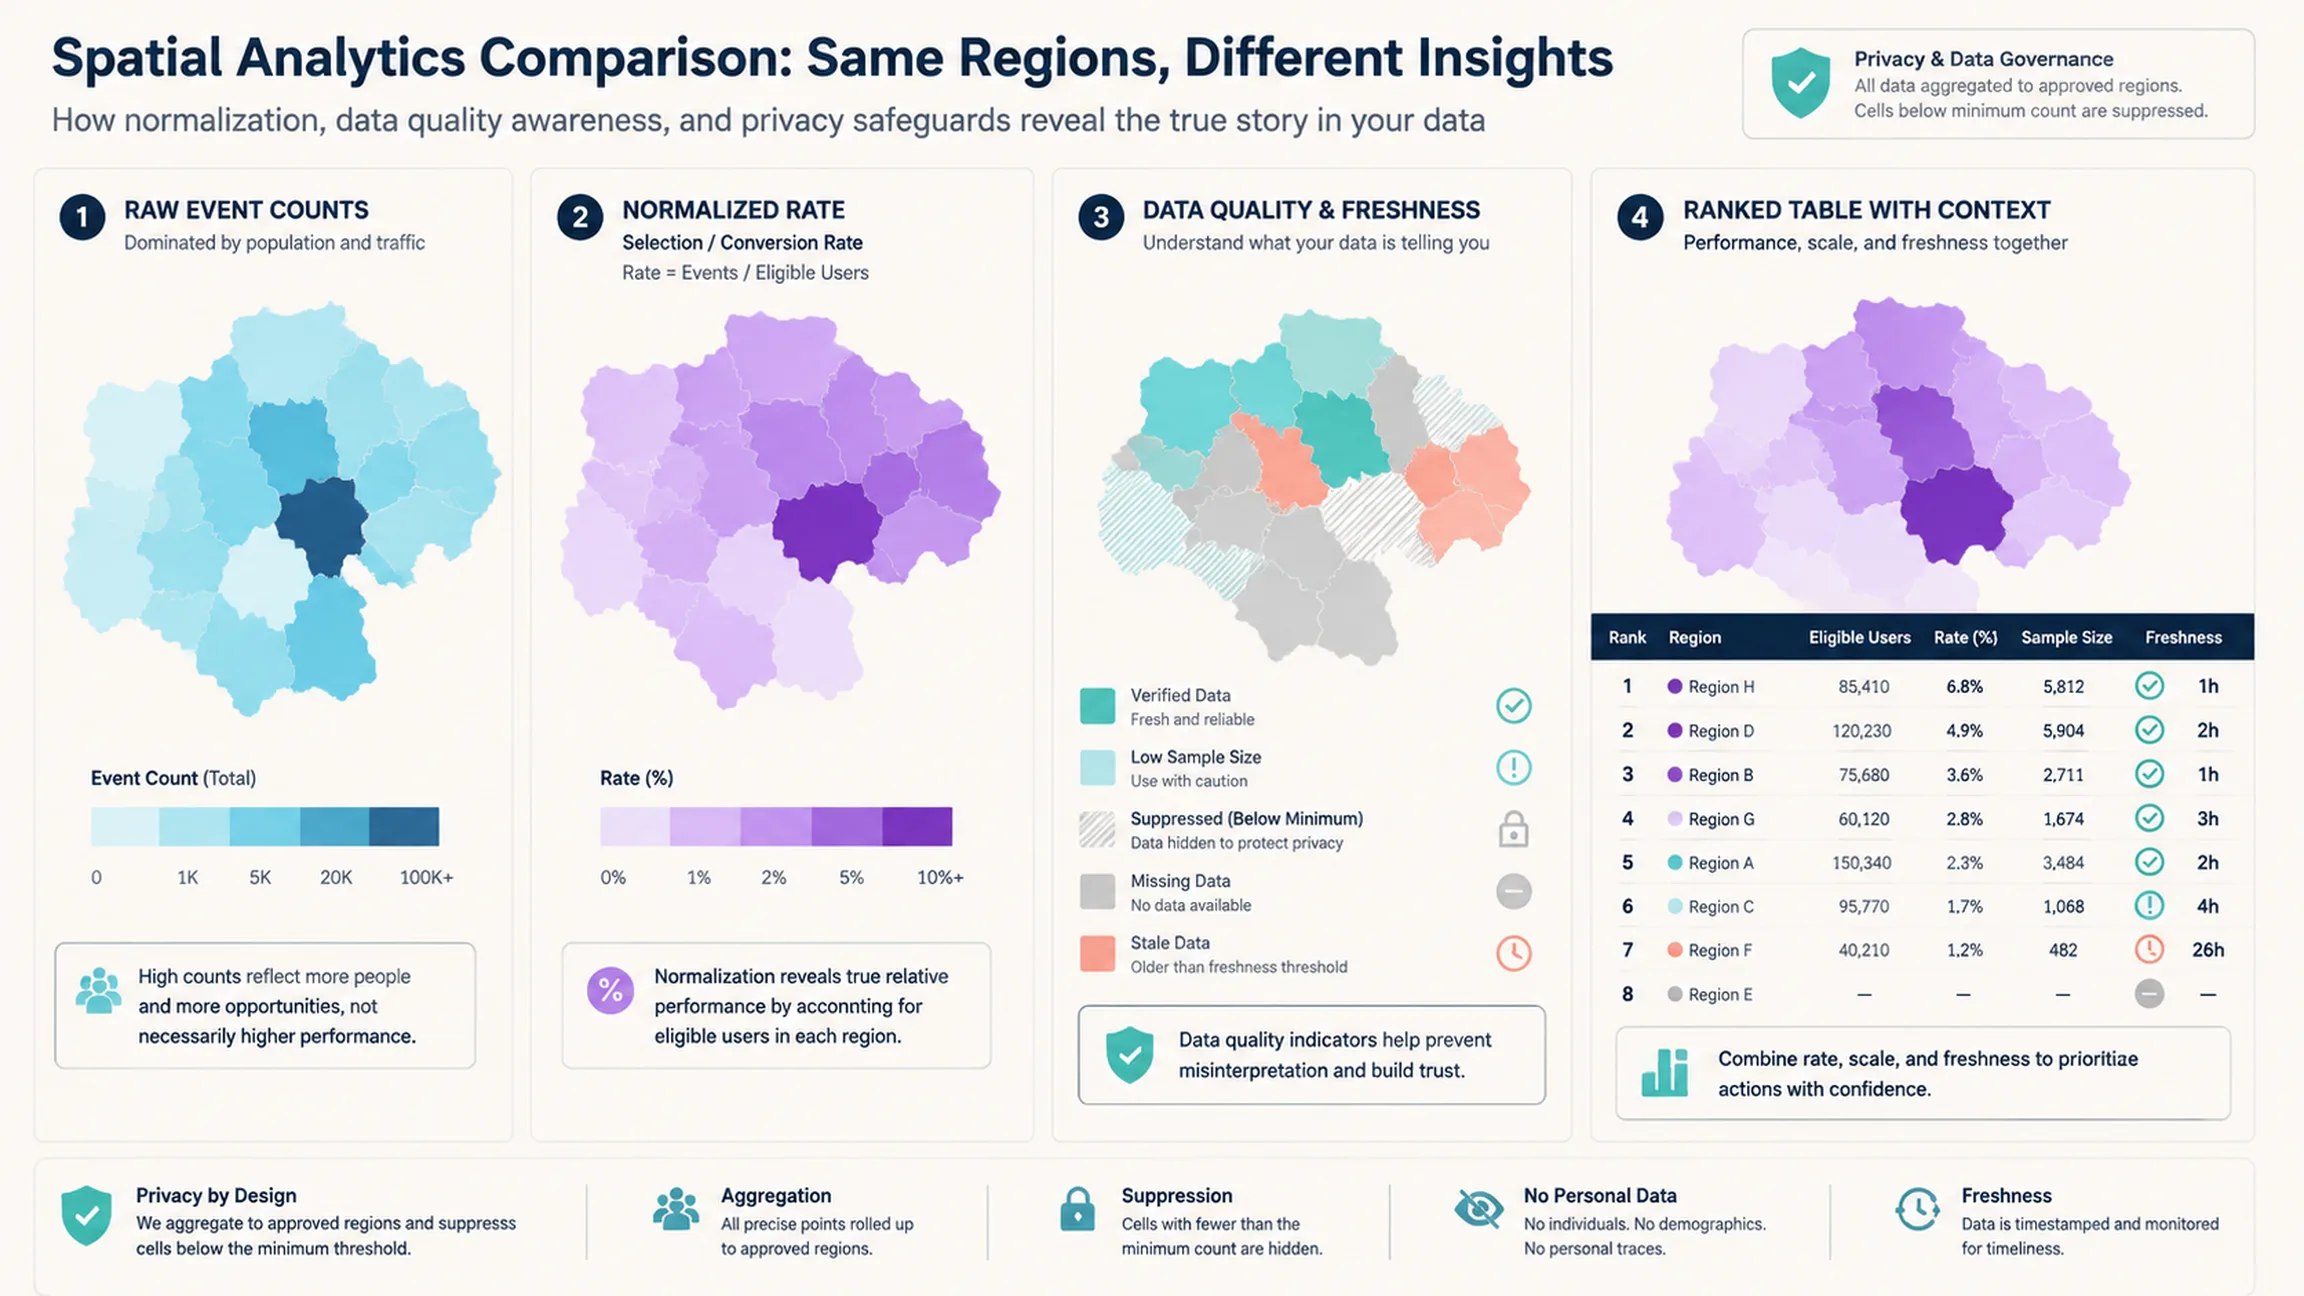
Excluir o etiquetar el desarrollo y el tráfico de puesta en escena. Deduplicar remontajes y conmutadores de cuenta. Alerta sobre la calidad y fiabilidad con tamaños mínimos de muestra para que las regiones delgadas no desencadenen ruido. Revise las métricas de control operativas sobre una cadencia corta, los embudos semanales y las tendencias geográficas o de retención estratégicas en una cadencia más larga.
¿Qué errores deben evitar los equipos?
| Error | ¿Qué pasa | Corrección recomendada |
|---|---|---|
| Tratar las cargas de mapas como un éxito | La actividad se confunden con el valor | Estrella del Norte sobre los resultados útiles |
| Gráficos antes de nombrar una decisión | Dashboard se convierte en un museo métrico | Escribe la sentencia de decisión primero |
| Conteos regionales crudos solamente | Tráfico parece rendimiento | Normalizar con denominadores |
| Colapsar desaparecidos en cero | Las brechas de cobertura se esconden como “sin demanda” | Separar cero, falta, suprimido |
| Inventar resultados de negocio en el cliente | Conversiones falsas ingrese informes | Unirse a sistemas autorizados |
| Publicar geografía de bajo volumen | La conducta individual puede ser inferible | Agregación y recuentos mínimos |
| Mezclar los números de GA4 y de almacén silenciosamente | La confianza colapsa | Documenta una fuente de verdad por KPI |
| Suponiendo que Kaleidr emite todos los eventos recomendados | Los equipos esperan el seguimiento automático indocumentado | Trata los eventos editoriales como contratos de anfitrión |
Antes de su publicación, apruebe la declaración de decisión, versione la taxonomía del evento, rija los identificadores de mapa y lugar, implemente umbrales de privacidad, pruebe el comportamiento de remoción y consentimiento, distinga el no resultado de los errores, etiqueta la frescura y proporcione una tabla accesible para las vistas geográficas.
Veredicto final
Un panel de análisis espacial debe explicar si un mapa ayuda a los usuarios a completar una tarea dependiente de la ubicación y dónde la geografía cambia el resultado. Comience con una decisión comercial, una métrica de estrella del norte y un pequeño conjunto de métricas de control. Conecte la exposición a la activación, la resolución útil, el compromiso, el resultado del negocio y la retención. Añadas dimensiones de lugar y región solo donde mejoren la decisión. Normalizar las comparaciones geográficas, proteger los datos de ubicación precisos y separar la cobertura faltante de la demanda cero real.
Kaleidr Analytics puede proporcionar informes centrados en el mapa y el lugar a través de sesiones, vistas, interacciones, actividad de la audiencia y tendencias espaciales. Una pila de análisis de host puede agregar adquisiciones, embudos personalizados, cohortes, análisis de almacenes y resultados autorizados. La configuración más fuerte no obliga a un panel de control a poseer cada hecho; le da a cada métrica una fuente documentada y conecta capas a través de identificadores estables.
Descubre Kaleidr Analytics para medir la interacción con mapas
Analiza sesiones, vistas, interacciones, actividad de la audiencia, atención a lugares y tendencias espaciales con Kaleidr Analytics. El acceso público se está habilitando por etapas, así que confirma la disponibilidad para tu espacio de trabajo antes de usarlo en producción. Descubre Kaleidr Analytics para conocer el modelo de informes centrado en mapas y lugares; después, alinea los eventos y denominadores de tu sistema anfitrión con la misma decisión que debe respaldar el panel.
Preguntas frecuentes
¿Qué es un panel de análisis espacial?
Un panel de análisis espacial informa el comportamiento del producto en contexto geográfico. Combina eventos de mapas con lugares, regiones, cobertura de búsqueda, patrones espaciales y resultados comerciales.
¿En qué se diferencia el análisis espacial del análisis web?
El análisis web organiza principalmente la actividad por páginas, sesiones, campañas y usuarios. El análisis espacial también organiza la actividad por mapas, lugares, áreas geográficas, distancia, cobertura y flujos de trabajo dependientes de la ubicación.
¿Qué debe medir primero un panel de mapas?
Mida primero un resultado útil del usuario, como un lugar seleccionado, un destino guardado, un inicio de ruta, una consulta, un mapa publicado o una tarea operativa completada. Añada vistas de mapa e interacciones mecánicas como métricas de soporte.
¿Son útiles los desplazamientos y el zoom como métricas?
Pueden ayudar a diagnosticar la usabilidad y la exploración, pero por lo general no deben servir como métricas de éxito primarias. Un usuario puede completar una tarea con muy poco movimiento del mapa.
¿Puede Google Analytics crear un panel de análisis espacial?
GA4 puede recopilar eventos de mapa personalizados, crear embudos y rutas, exponer datos de informes a través de la API de datos y exportar eventos en bruto a BigQuery. Todavía se necesita una capa espacial o específica de mapa para administrar bien el lugar, la región, la geometría y el contexto de cobertura.
¿Kaleidr Analytics registra automáticamente todos los eventos recomendados en este artículo?
No. No. Los nombres de los eventos aquí son recomendaciones editoriales. La página pública de análisis de Kaleidr describe sesiones, vistas, interacciones, actividad de audiencia, atención al lugar y tendencias espaciales, pero no documenta la emisión automática de cada evento propuesto en esta guía.
¿Cómo deben tratarse las ubicaciones precisas de los usuarios?
Recopile la precisión mínima requerida, restrinja el acceso, defina la retención, agregue informes, suprima las regiones de bajo volumen y evite enviar coordenadas o direcciones personales en bruto a sistemas analíticos amplios de forma predeterminada.
¿Por qué GA4 y BigQuery pueden mostrar cifras diferentes?
Google documenta las diferencias entre los informes, las exploraciones, la API de datos y BigQuery porque esas superficies pueden aplicar diferentes reglas de identidad, modelado, umbralización, procesamiento y disponibilidad de informes. Documentar una fuente de verdad para cada KPI.
Referencias
- Google. Set up Events. Google Analytics for Developers. Accessed 6 August 2026. https://developers.google.com/analytics/devguides/collection/ga4/events
- Google. Custom Events. Analytics Help. Accessed 6 August 2026. https://support.google.com/analytics/answer/12229021
- Google. Funnel Exploration. Analytics Help. Accessed 6 August 2026. https://support.google.com/analytics/answer/9327974
- Google. Path Exploration. Analytics Help. Accessed 6 August 2026. https://support.google.com/analytics/answer/9317498
- Google. Google Analytics Data API Overview. Google for Developers. Accessed 6 August 2026. https://developers.google.com/analytics/devguides/reporting/data/v1
- Google. Create a Report. Google Analytics Data API. Accessed 6 August 2026. https://developers.google.com/analytics/devguides/reporting/data/v1/basics
- Google. BigQuery Export. Analytics Help. Accessed 6 August 2026. https://support.google.com/analytics/answer/9358801
- Google. Set up BigQuery Export. Analytics Help. Accessed 6 August 2026. https://support.google.com/analytics/answer/9823238
- Google. BigQuery Export Schema. Analytics Help. Accessed 6 August 2026. https://support.google.com/analytics/answer/7029846
- Google. Reporting Surfaces Comparison. Analytics Help. Accessed 6 August 2026. https://support.google.com/analytics/answer/13644080
- Google. Compare Analytics Reports and Data Exported to BigQuery. Analytics Help. Accessed 6 August 2026. https://support.google.com/analytics/answer/13578783
- Kaleidr. Spatial & Audience Analytics Dashboard. kaleidr.com. Accessed 6 August 2026. https://kaleidr.com/analytics
- Kaleidr. Pricing & Plans. kaleidr.com. Accessed 6 August 2026. https://kaleidr.com/pricing
@misc{kaleidr_analytics,
  title  = {Spatial and Audience Analytics Dashboard},
  author = {{Kaleidr}},
  note   = {Accessed 6 August 2026},
  url    = {https://kaleidr.com/analytics}
}

@misc{google_ga4_events,
  title  = {Set up Events},
  author = {{Google}},
  note   = {Google Analytics for Developers; accessed 6 August 2026},
  url    = {https://developers.google.com/analytics/devguides/collection/ga4/events}
}

@misc{google_ga4_funnel,
  title  = {Funnel Exploration},
  author = {{Google}},
  note   = {Analytics Help; accessed 6 August 2026},
  url    = {https://support.google.com/analytics/answer/9327974}
}

@misc{google_ga4_bigquery,
  title  = {BigQuery Export},
  author = {{Google}},
  note   = {Analytics Help; accessed 6 August 2026},
  url    = {https://support.google.com/analytics/answer/9358801}
}

@misc{google_analytics_data_api,
  title  = {Google Analytics Data API Overview},
  author = {{Google}},
  note   = {Google for Developers; accessed 6 August 2026},
  url    = {https://developers.google.com/analytics/devguides/reporting/data/v1}
}

@misc{google_bq_vs_reports,
  title  = {Compare Analytics Reports and Data Exported to BigQuery},
  author = {{Google}},
  note   = {Analytics Help; accessed 6 August 2026},
  url    = {https://support.google.com/analytics/answer/13578783}
}